As the director of software product design, I am responsible for the software experience for users before, during, and after active sessions on the hardware. The cornerstone of our value prop is providing data and insights with our performance testing mode.
This case study highlights our year-long effort to deliver an impactful reporting experience, leading to a 24% increase in testing usage.
Organization
Proteus Motion
My Role
Principal Designer / Design Manager
The Team
Steven Bazarian, Andres Gonzalez, Brendan Kelly, Justin Maskell, Doug Moore, Jason Shaev, Jaskar Singh, Will Waterman
Testing is our bread and butter
Proteus is primarily an assessment tool for measuring peak power production in the human body. Trainers administer a relevant test for their client from our Performance Testing catalog, during which hardware sensors record data on power, acceleration, velocity, and side imbalances. This data, crucial for expanding our database of performance norms, is only collected during testing.
Our customers' success is vital to our own. Testing helps athletes set training benchmarks and track progress toward their goals, thereby proving trainers' value and expertise. Our diagnostic reports benefit our customers by increasing client retention, enabling more referrals, and can even generate direction additional revenue through paid testing services.
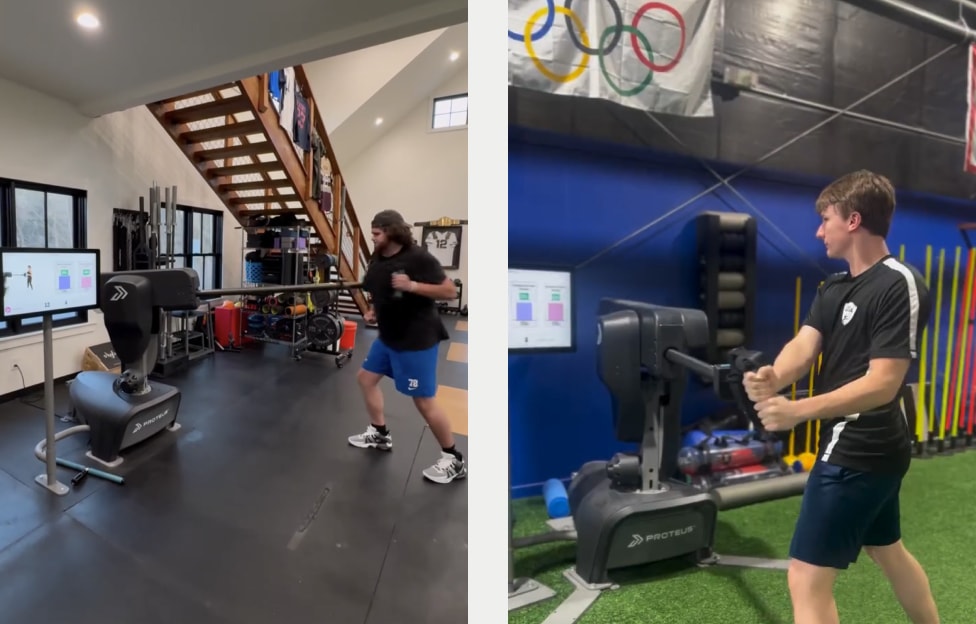
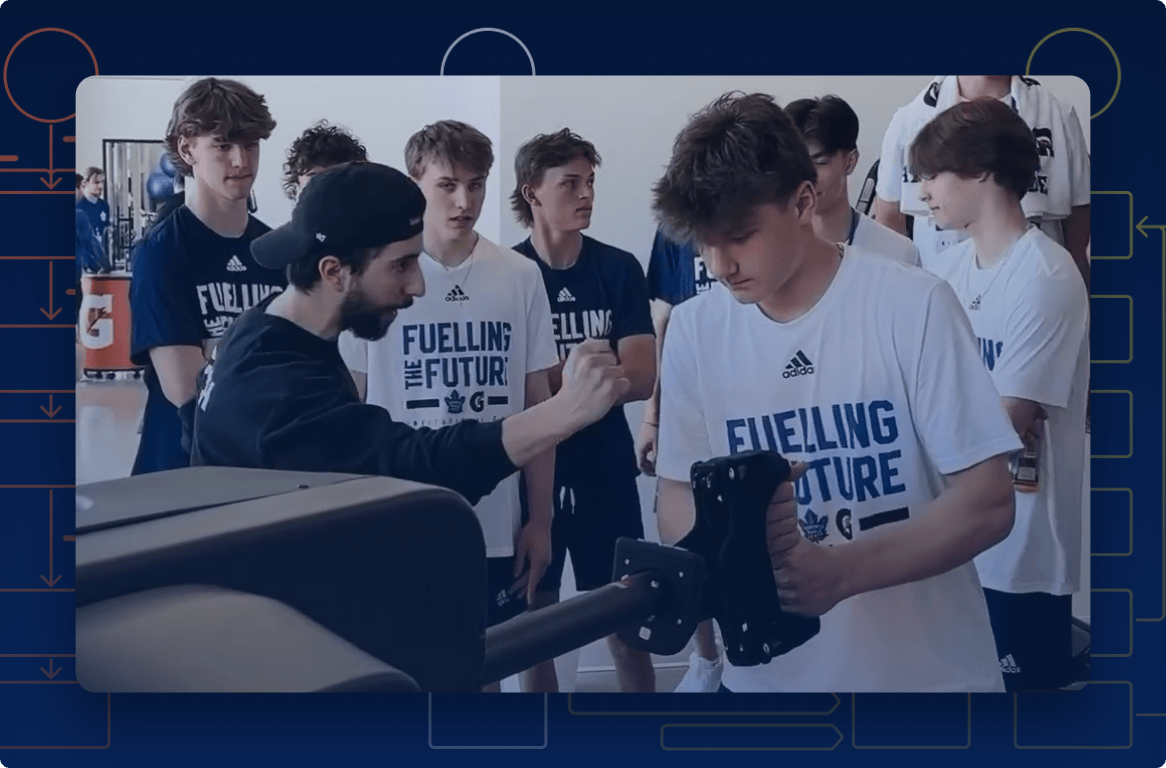
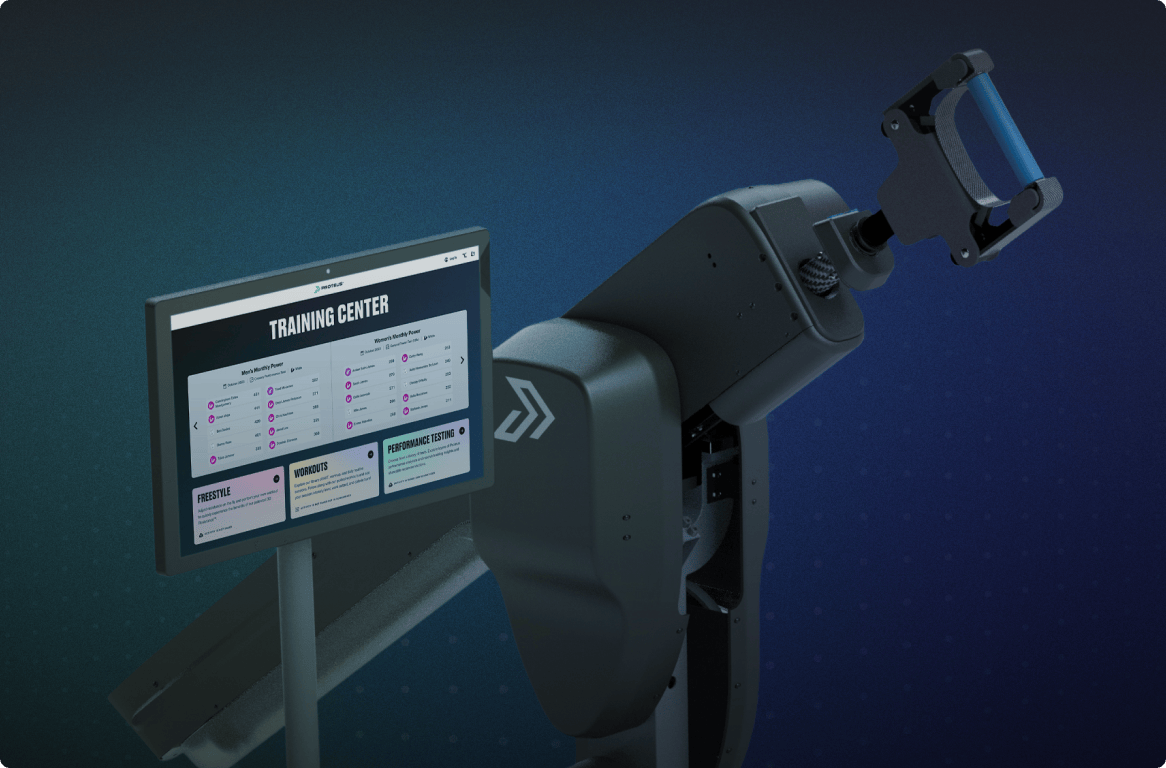
Proteus in use
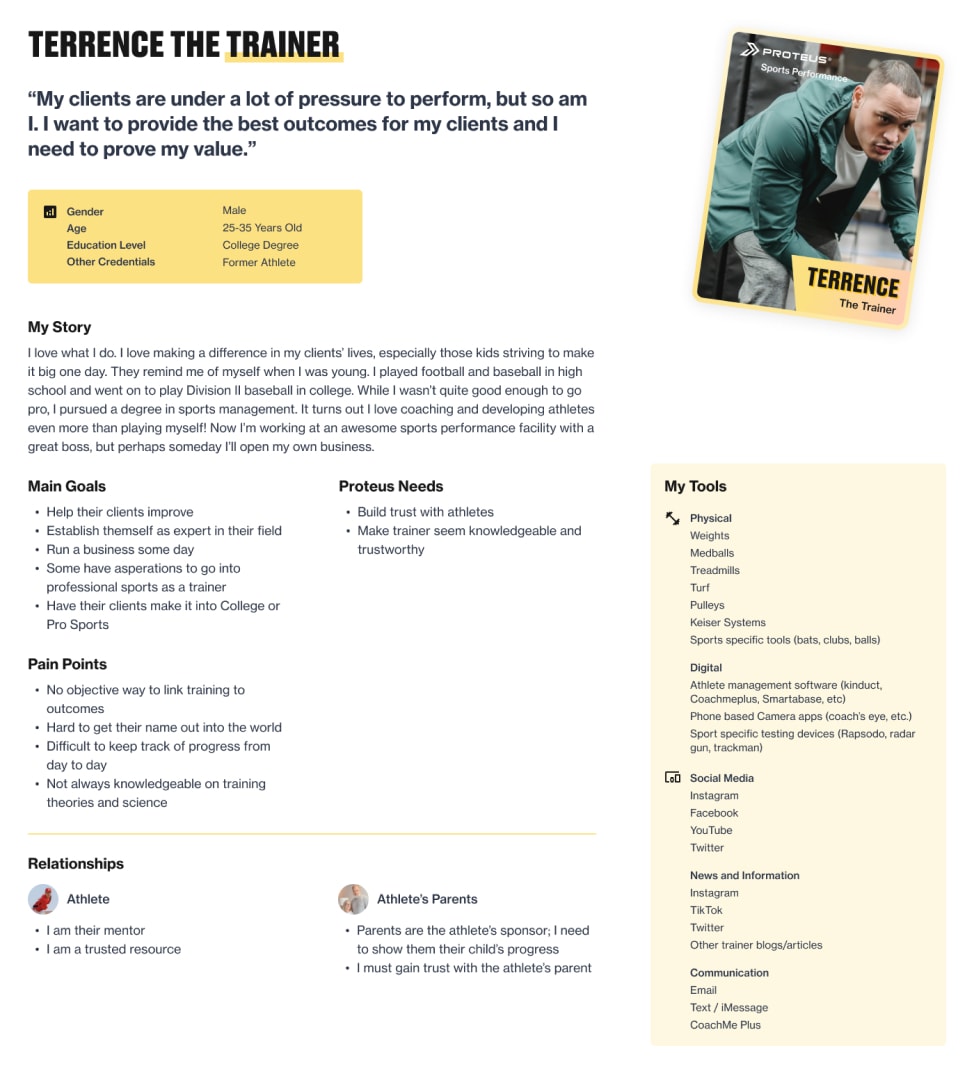
Trainer user persona
Enhancing understanding and providing guidance
To gather more performance data and demonstrate our product’s value, we needed to reframe test data to be more valuable to trainers. I was tasked with reimagining the test reporting experience to make results understandable for trainers of all levels, their clients, and sponsors like parents or coaches.
This involved developing a new framework for classifying results, rethinking the reporting experience architecture, elevating the visual design, and providing athletes with a condensed version of the report for daily training. Since most software engagement occurs on Proteus hardware, we optimized the experience for the attached touch screen.
Although there were no explicit target metrics, the goals were to increase tests performed per site and improve customer sentiment around our testing mode.
Developing an extensible reporting platform
This very large project (especially for the size of the team) spanned the greater part of a year. Our team broke the work down into four phases with the following goals:
Phase 1
Make data personally relevant via athletic cohorts
Phase 2
Provide basic guidance through a new results classification system
Phase 3
Frame results simply with recommendations to assist in program building
Phase 4
Provide a digital training guide for athletes to reference between tests
Implementing the experience in phases allowed frequent releases and testing of new concepts, leading to a more refined final product. The main body of work occurred during 2022, with further iteration throughout 2023. This case study features sample artifacts from the latest version, but the core features and principles have remained consistent since the initial launches.
Make data personally relevant via athletic cohorts
Originally, performance data was presented in native units (e.g., watts for power, m/s² for acceleration) or as percentile scores compared to all Proteus users. This confused many users, as they couldn't gauge the practical relevance or quality of their results. Global percentiles were also misleading due to the diverse user base, from little league players to NFL quarterbacks and retirees in rehab.
To address this, I collaborated with our human performance experts to personalize test scores. I suggested using demographic information already collected—such as age, gender, height, weight, sport, and skill level—to define an athletic cohort for users. Framing data through the lens of the user’s cohort made the results more relevant and understandable, since they now could see how they compared to similar users.
Wireframe approaches for setting an athletic cohort
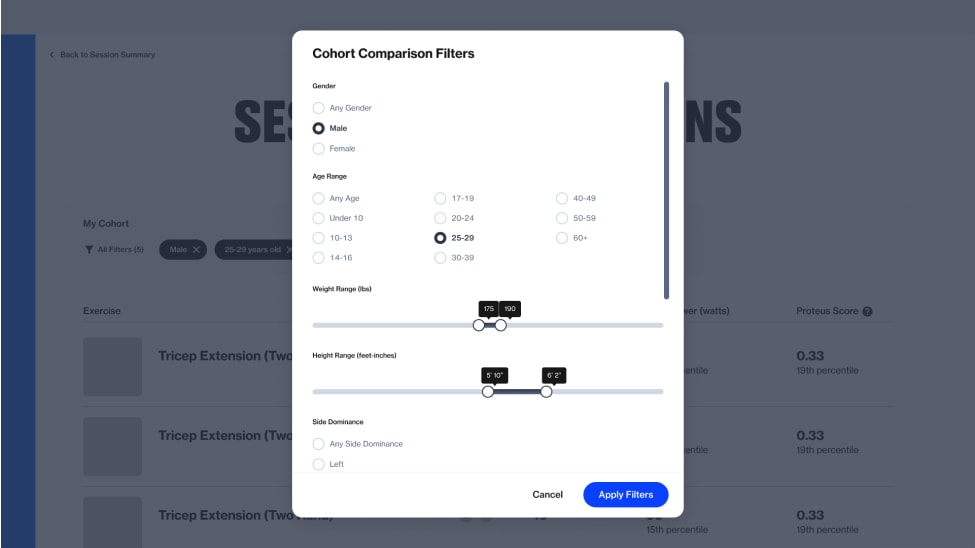
To facilitate setting an athletic cohort across various reporting views, I proposed using a modal approach. This would maximize screen space for displaying results and save future engineering effort. Recognizing limited data for certain sports or age groups, I suggested using broader ranges for age, weight, and height (e.g., every 15 lbs, 4 inches, or 5 years). Additionally, it was important to provide immediate feedback if selected settings wouldn’t yield statistically significant results.
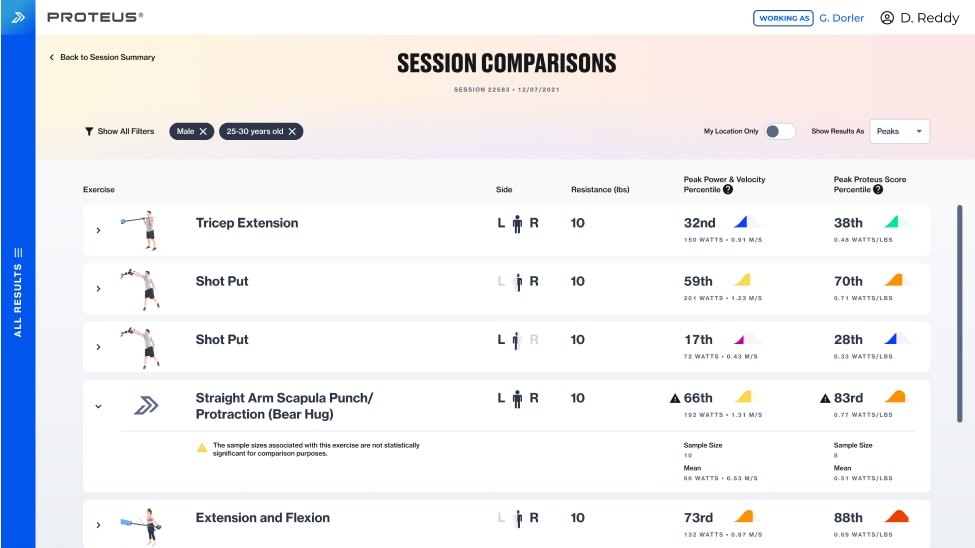
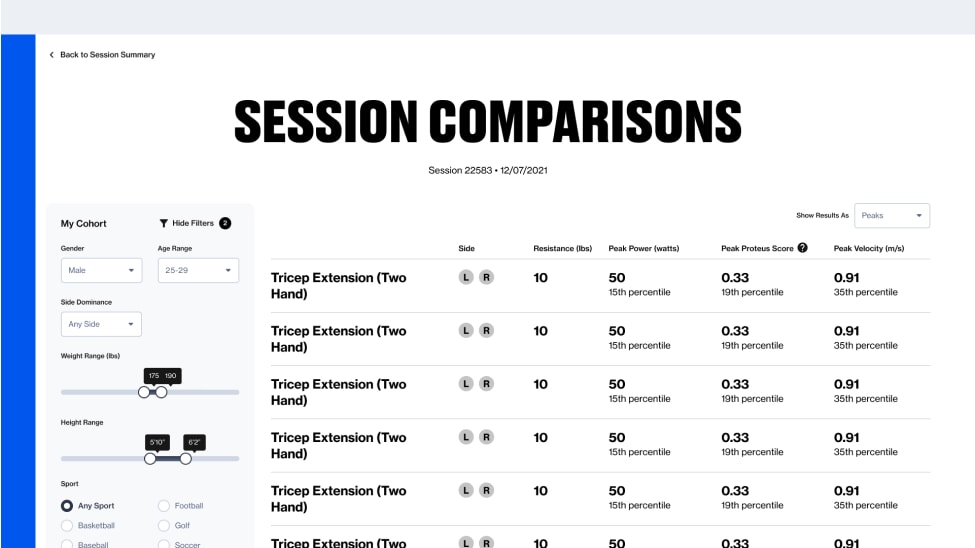
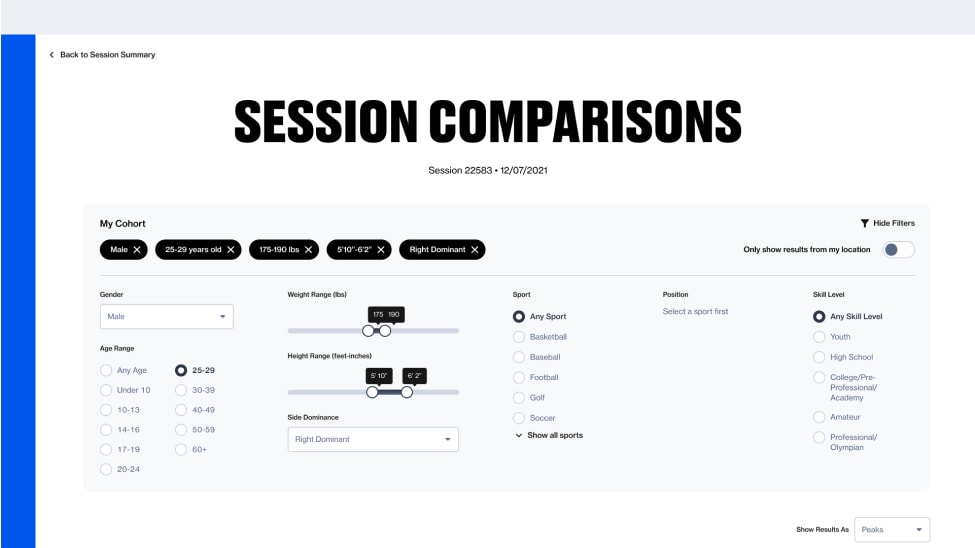
Redesigned Comparisons view
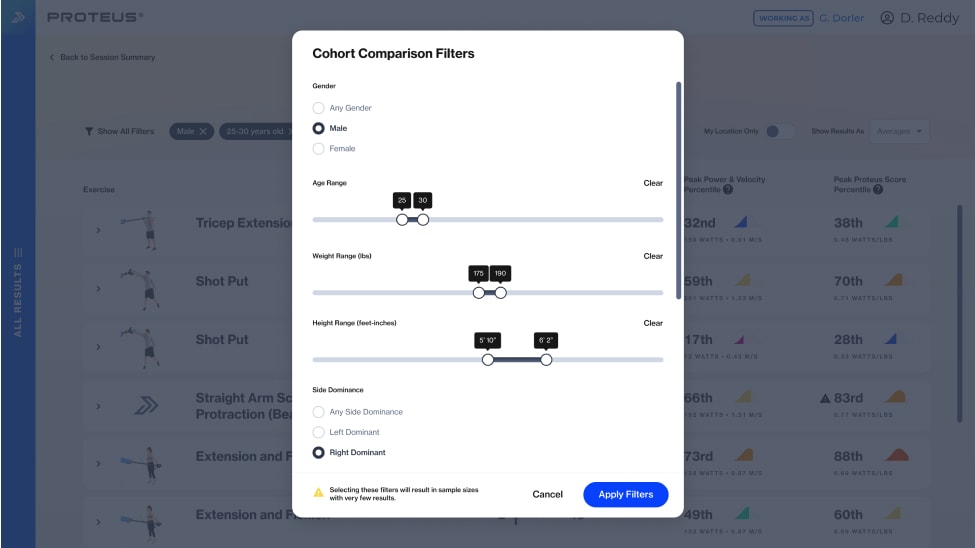
Cohort setting modal
Cohort selection applied to a Power Report
Session Comparisons was the first existing reporting view to benefit from cohort filtering. Originally, it only showed the user’s power and the average power for all users. The redesigned view displayed power and velocity scores in native units and personalized percentiles, along with cohort mean and sample sizes. The old Power Report (more on that later) received this cohort filtering feature a few months later.
Provide basic guidance through a new results classification system
While developing the Comparisons reporting view, we partnered with Equinox Fitness Club, deploying a Proteus unit at their Flatiron NYC location. This was our first unit in a "general fitness" chain, catering to a diverse clientele and employing trainers with varying levels of expertise. Convincing Equinox trainers to use Proteus for testing was essential, but their inability to leverage test results to inform client training programming prevented wider adoption.
To address this, our human performance SMEs created a system to classify athletes based on test scores, which included suggested training adaptations and exercises. To test this system and strengthen our relationship with Equinox, I designed a quick explainer for our Power Reports, which was laminated and attached to the hardware on site. This, along with in-person training sessions, boosted Proteus usage at Equinox. These classifications and recommendations became the foundation of our redesigned reporting platform.
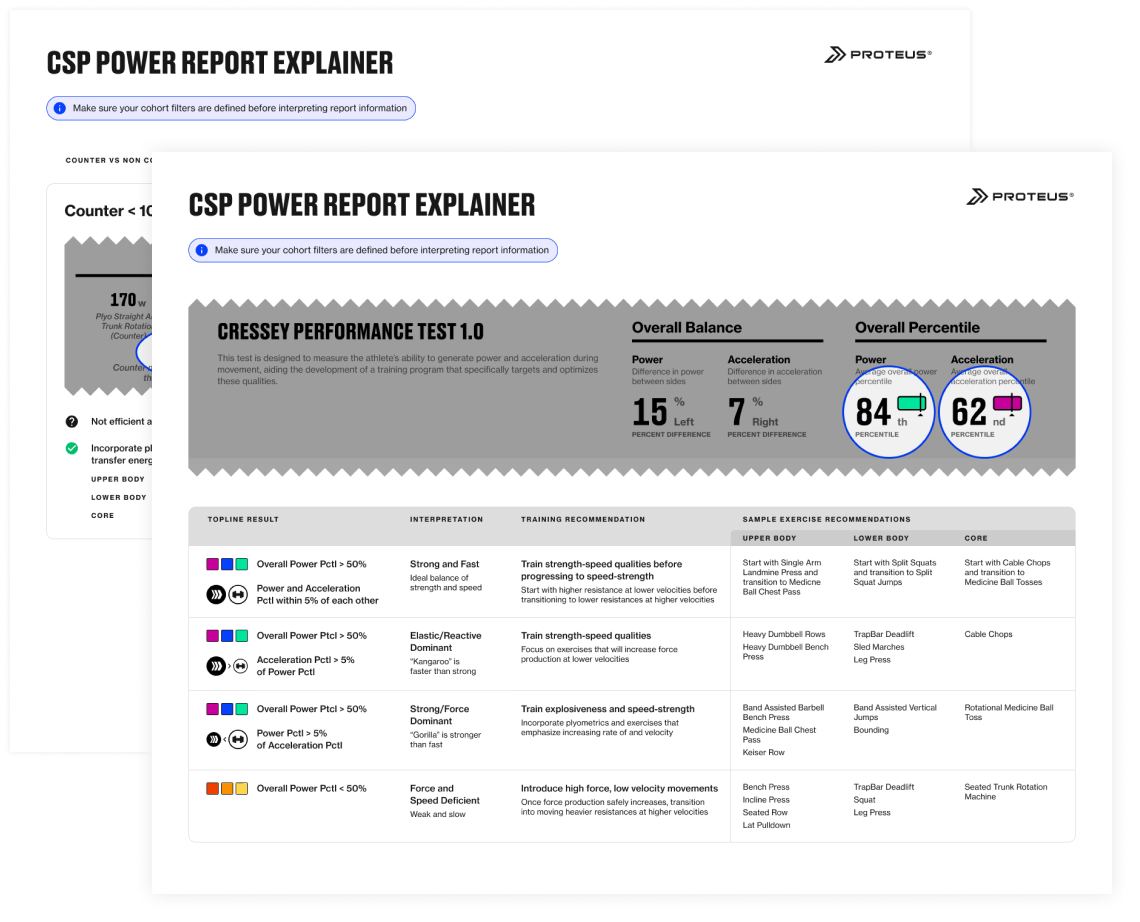
Low Power
Does not generate enough force to produce sufficient power
Below the 50th power percentile in your particular cohort
Speed Dominant
Does not possess power to use speed effectively
Above the 50th power percentile AND acceleration is greater than power by more than 5 percentile points
Strength Dominant
Does not possess appropriate speed to use power effectively
Above the 50th power percentile AND power is greater than acceleration by more than 5 percentile points
Balanced Power and Speed
Has an ideal balance of speed and power
Above the 50th power percentile AND power and acceleration are within 5 percentile points of each other
Frame results simply with recommendations to assist in program building
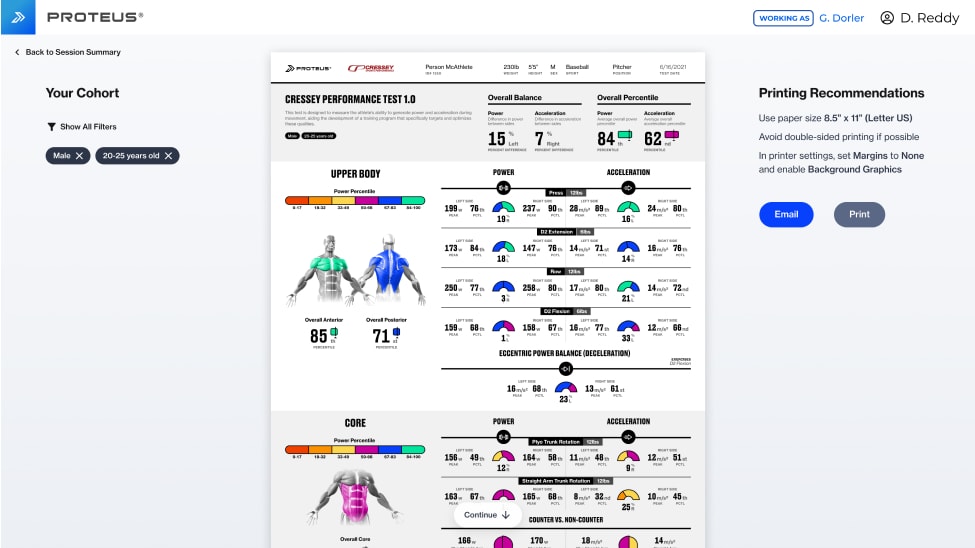
After developing a system for personalizing data via cohorts and framing results through classifications, we were ready to leverage these capabilities to prove our product's value and that of our customers. The CEO directed us to add a generalized training recommendation based on a user's overall power and acceleration percentile to the top of the old Power Report. While this seemed simple, I suspected it wasn't as straightforward as it appeared.
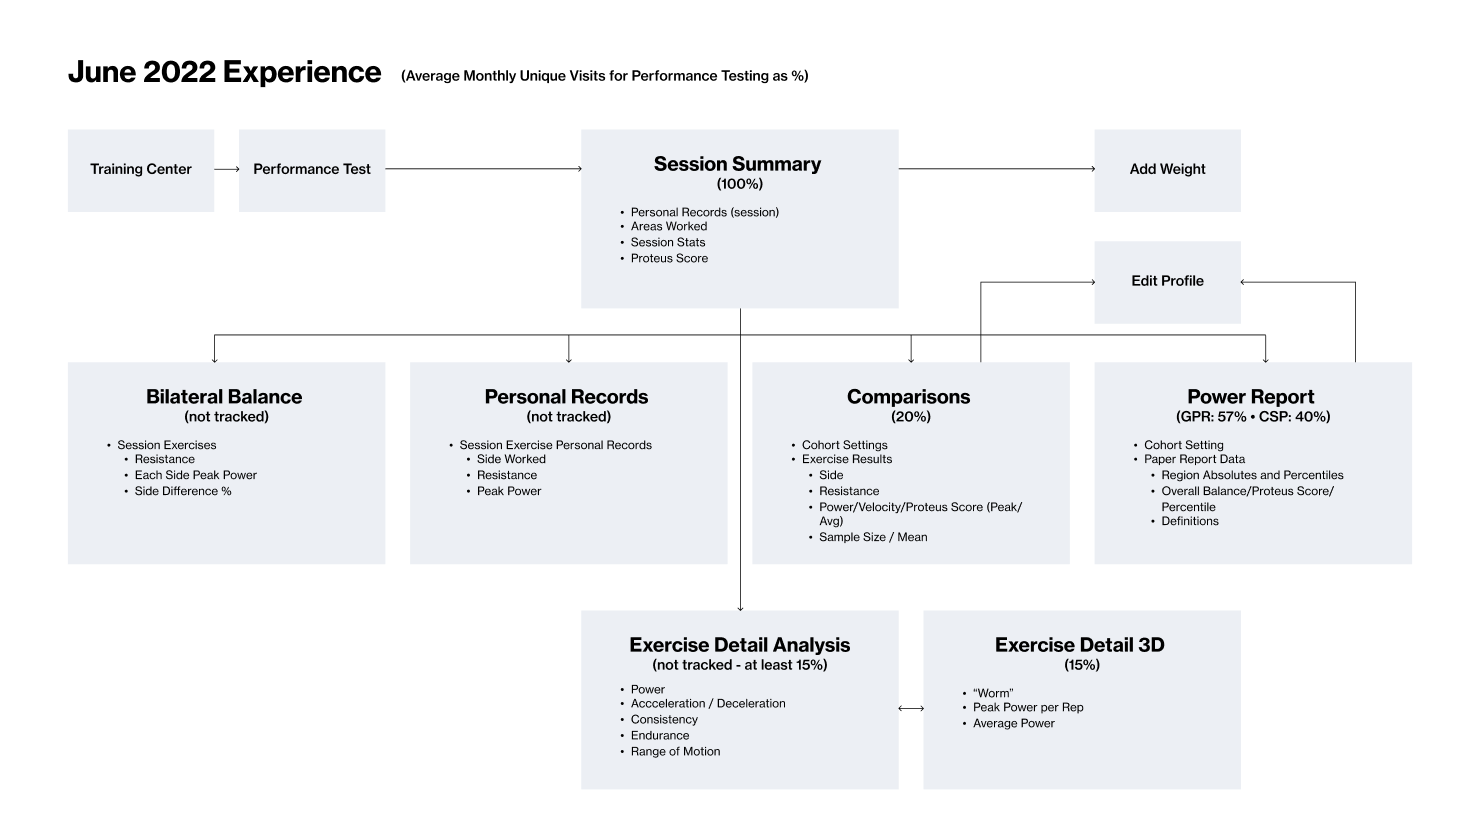
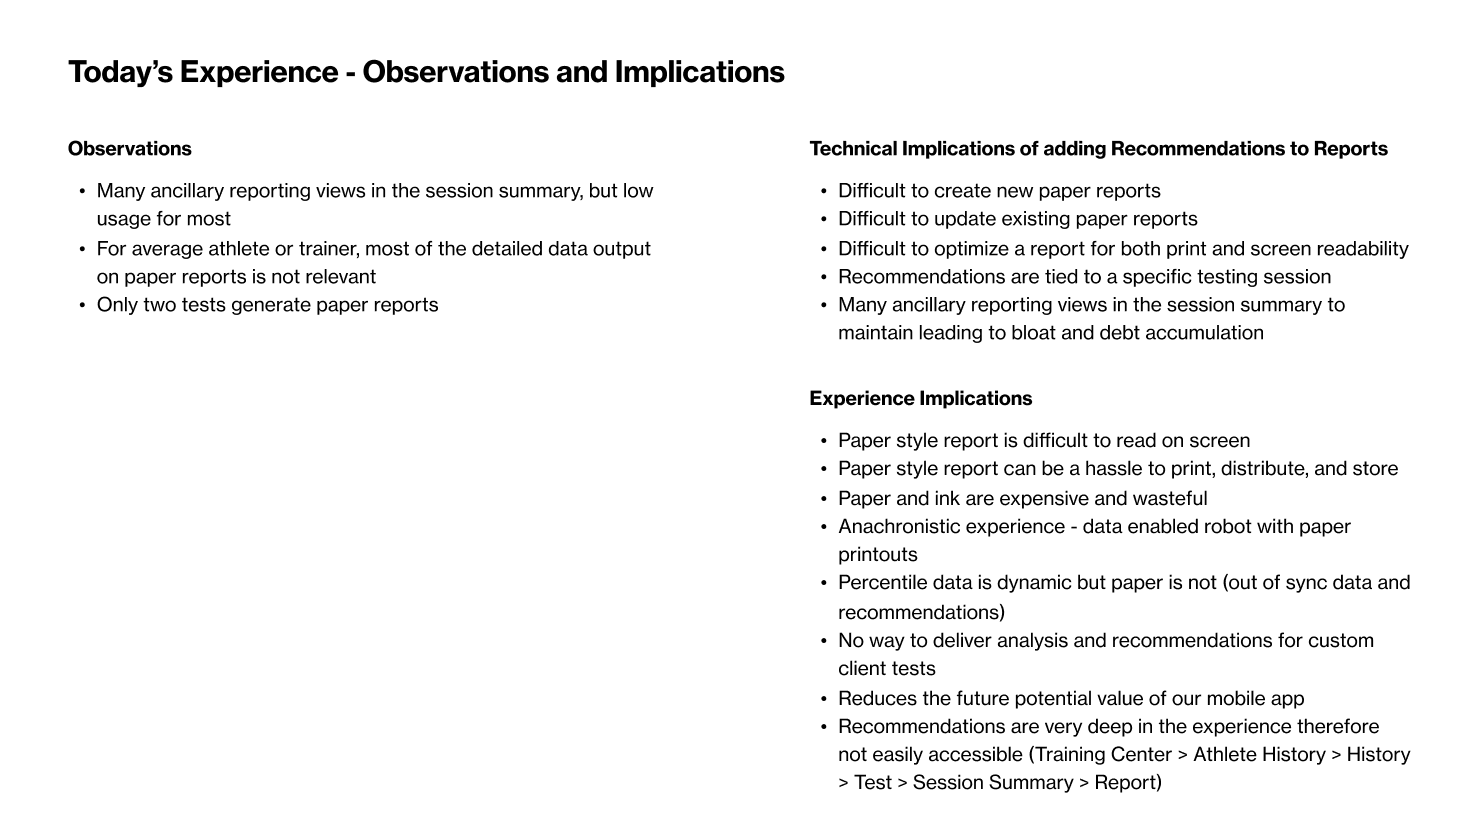
I audited the existing reporting experience, examining all states, provided data, and traffic flow. Through this process, I identified four key drawbacks with the proposed solution:
Due to the brittle nature of how these reports were built (optimized for printing), updating or adding content to them is very difficult.
There were only two Power Reports, each uniquely built for a specific test. Creating and maintaining bespoke reports for over 15 additional tests would require significant design and engineering effort.
Customers who had designed their own custom tests would never be able to receive the newly proposed insights and recommendations for those tests.
The existing Power Reports were already notoriously too dense and difficult to understand by most trainers, so adding more data would exacerbate that issue.
Current state audit
Instead, I proposed a reporting platform that could be expanded over time. It would utilize the customizable athletic cohorts and results classification in more powerful ways than initially envisioned by the CEO. This proposal offered three main benefits:
Benefit #1
Simplify the architecture by consolidating displayed data and removing redundant views
Benefit #2
Allow users to more easily parse the provided data by simplifying the views through progressive disclosure mechanics
Benefit #3
Easily apply the new capabilities and generated insights to potentially any test, regardless of origin
To gauge affinity for our proposed reporting platform, my junior designer and I developed two design directions for customer evaluation. I guided the designer in crafting a research plan and moderation guide to explore how trainers would navigate the reporting experience, interpret results, understand our new classification system, and apply recommendations to client programming. Each direction provided an overview of overall scores, followed by breakdowns into movement categories (umbrella groupings of similar movements activating the same muscles) and individual movements. Both directions incorporated the new classification system, recommended training adaptations, sample exercises, and a mobile-friendly training "pocket guide".
We conducted 5 interviews with existing Proteus customers, with me leading 4 and my designer observing and taking notes. I ensured he had the opportunity to conduct the final interview after shadowing my sessions. Synthesizing the responses, I identified trends in understanding and affinity, compiling them into a top-line research report for the team.
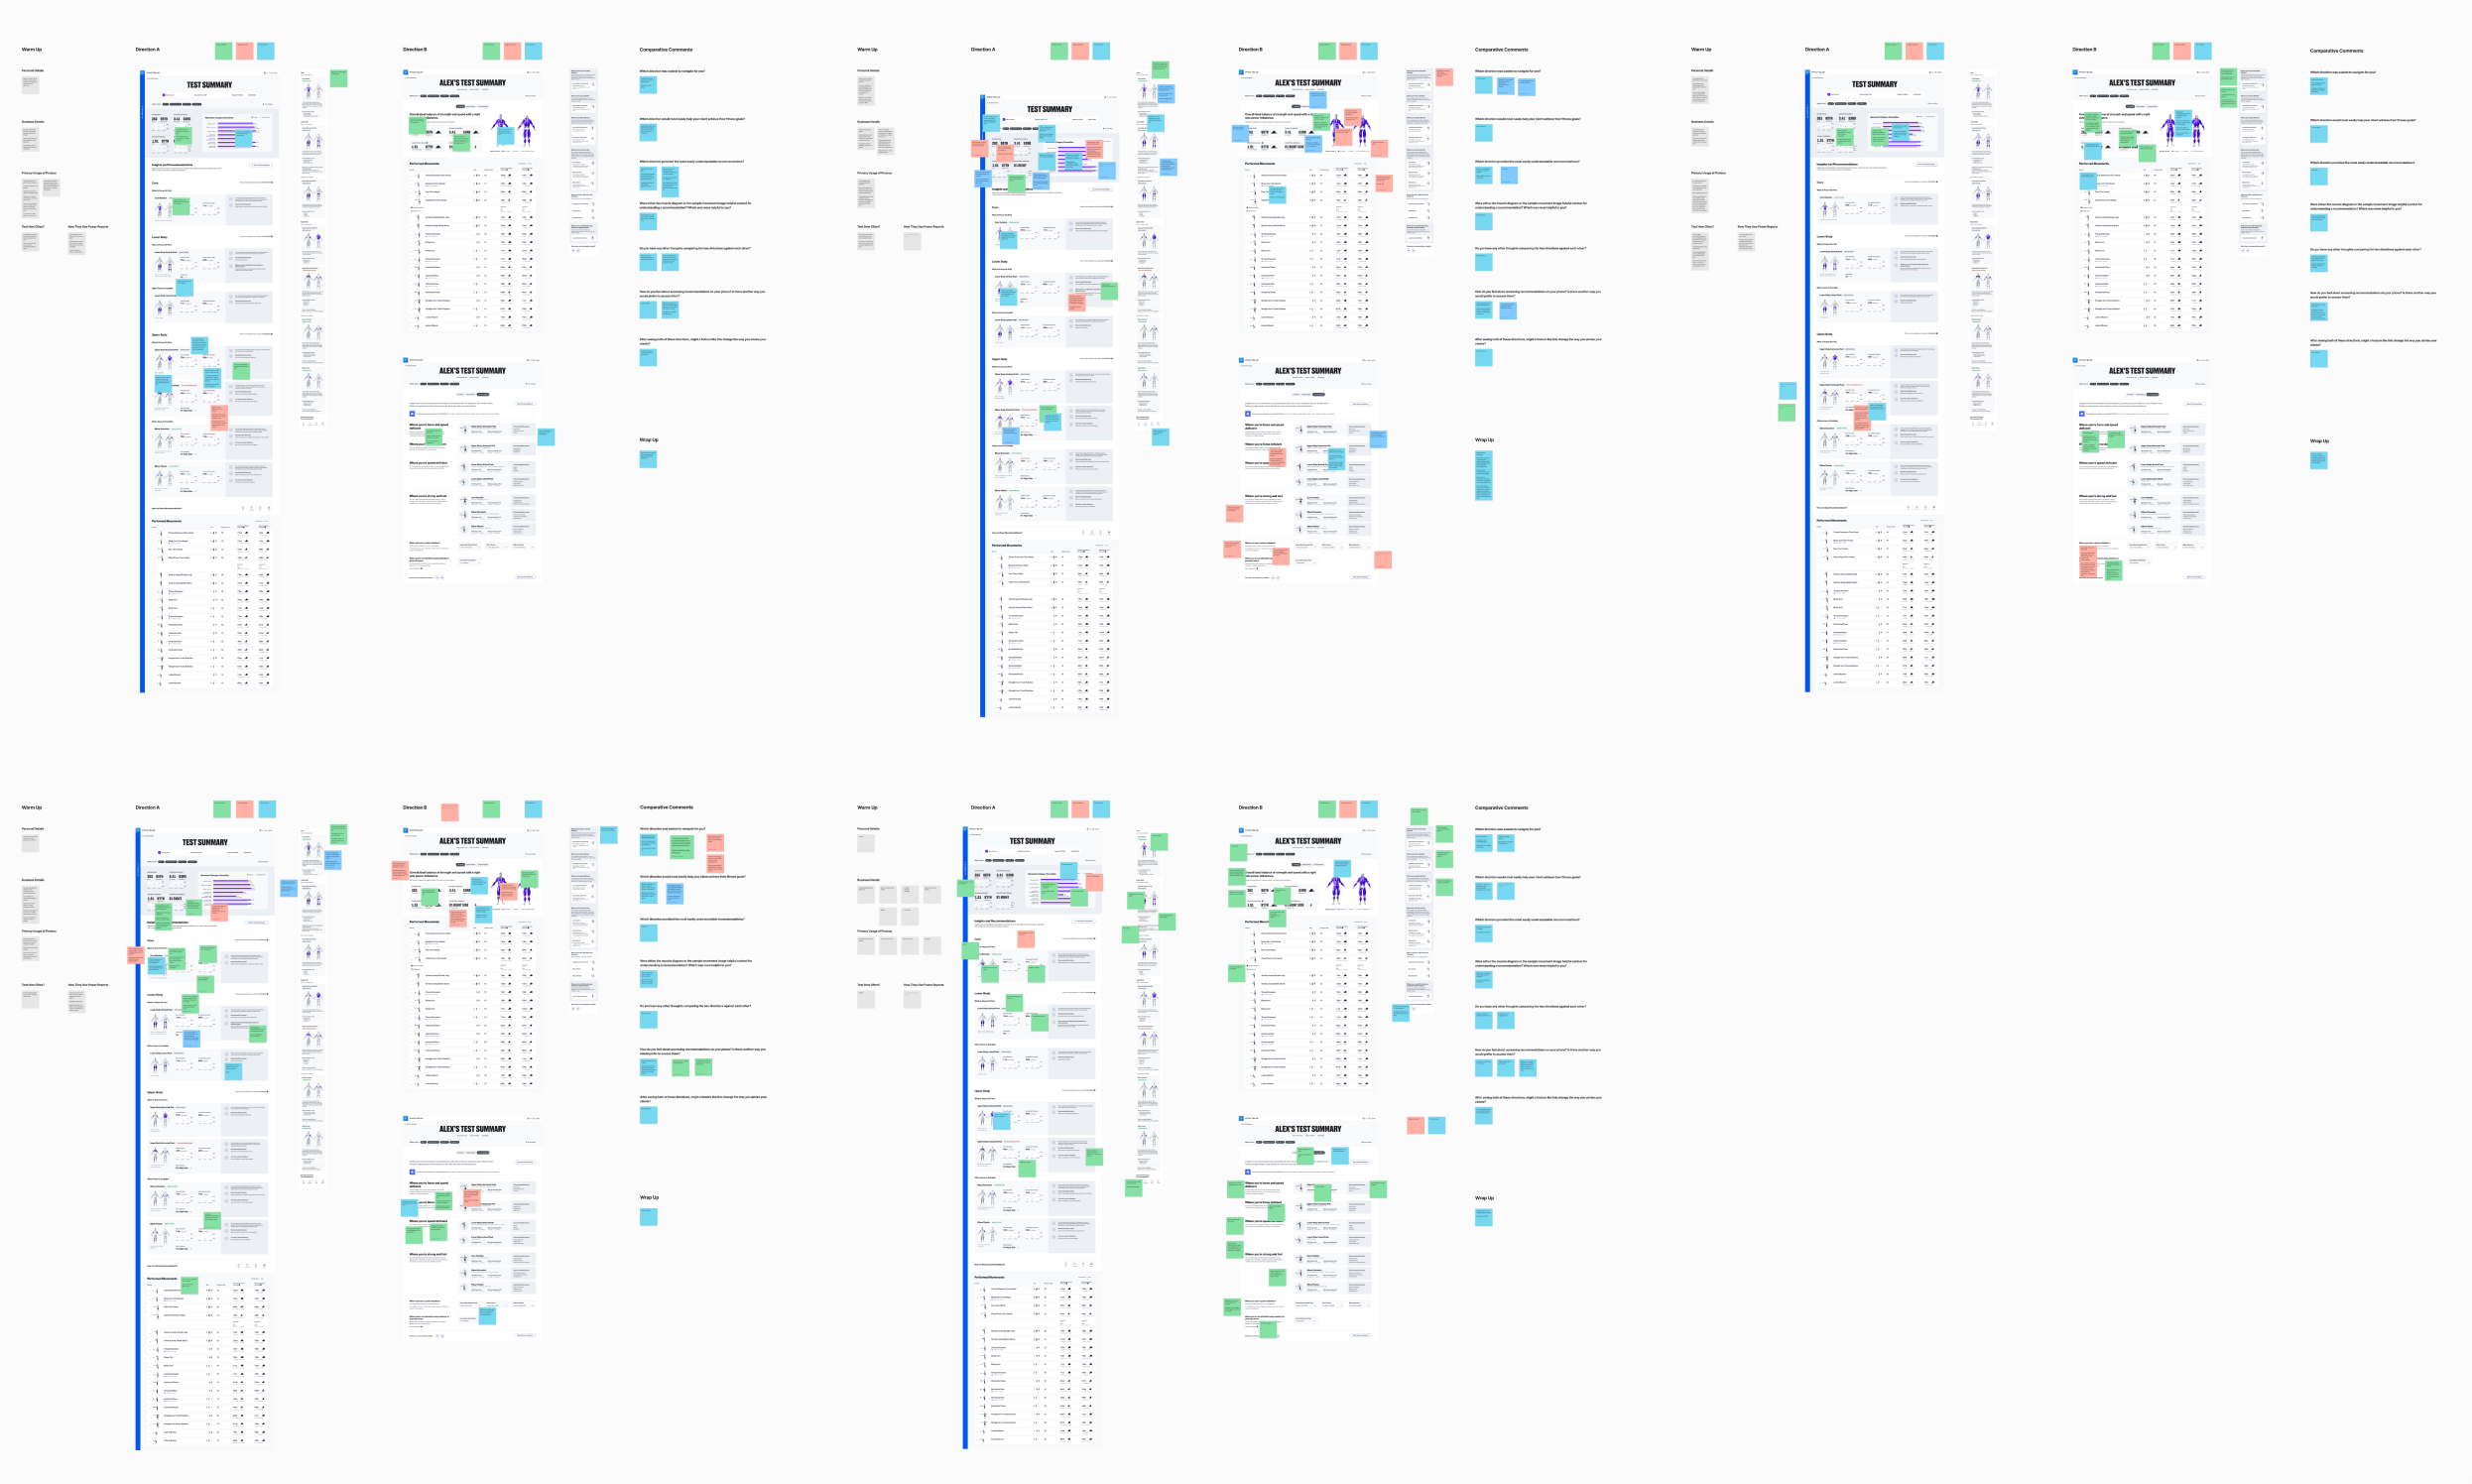
Fig Jam board for collecting respondent sentiment
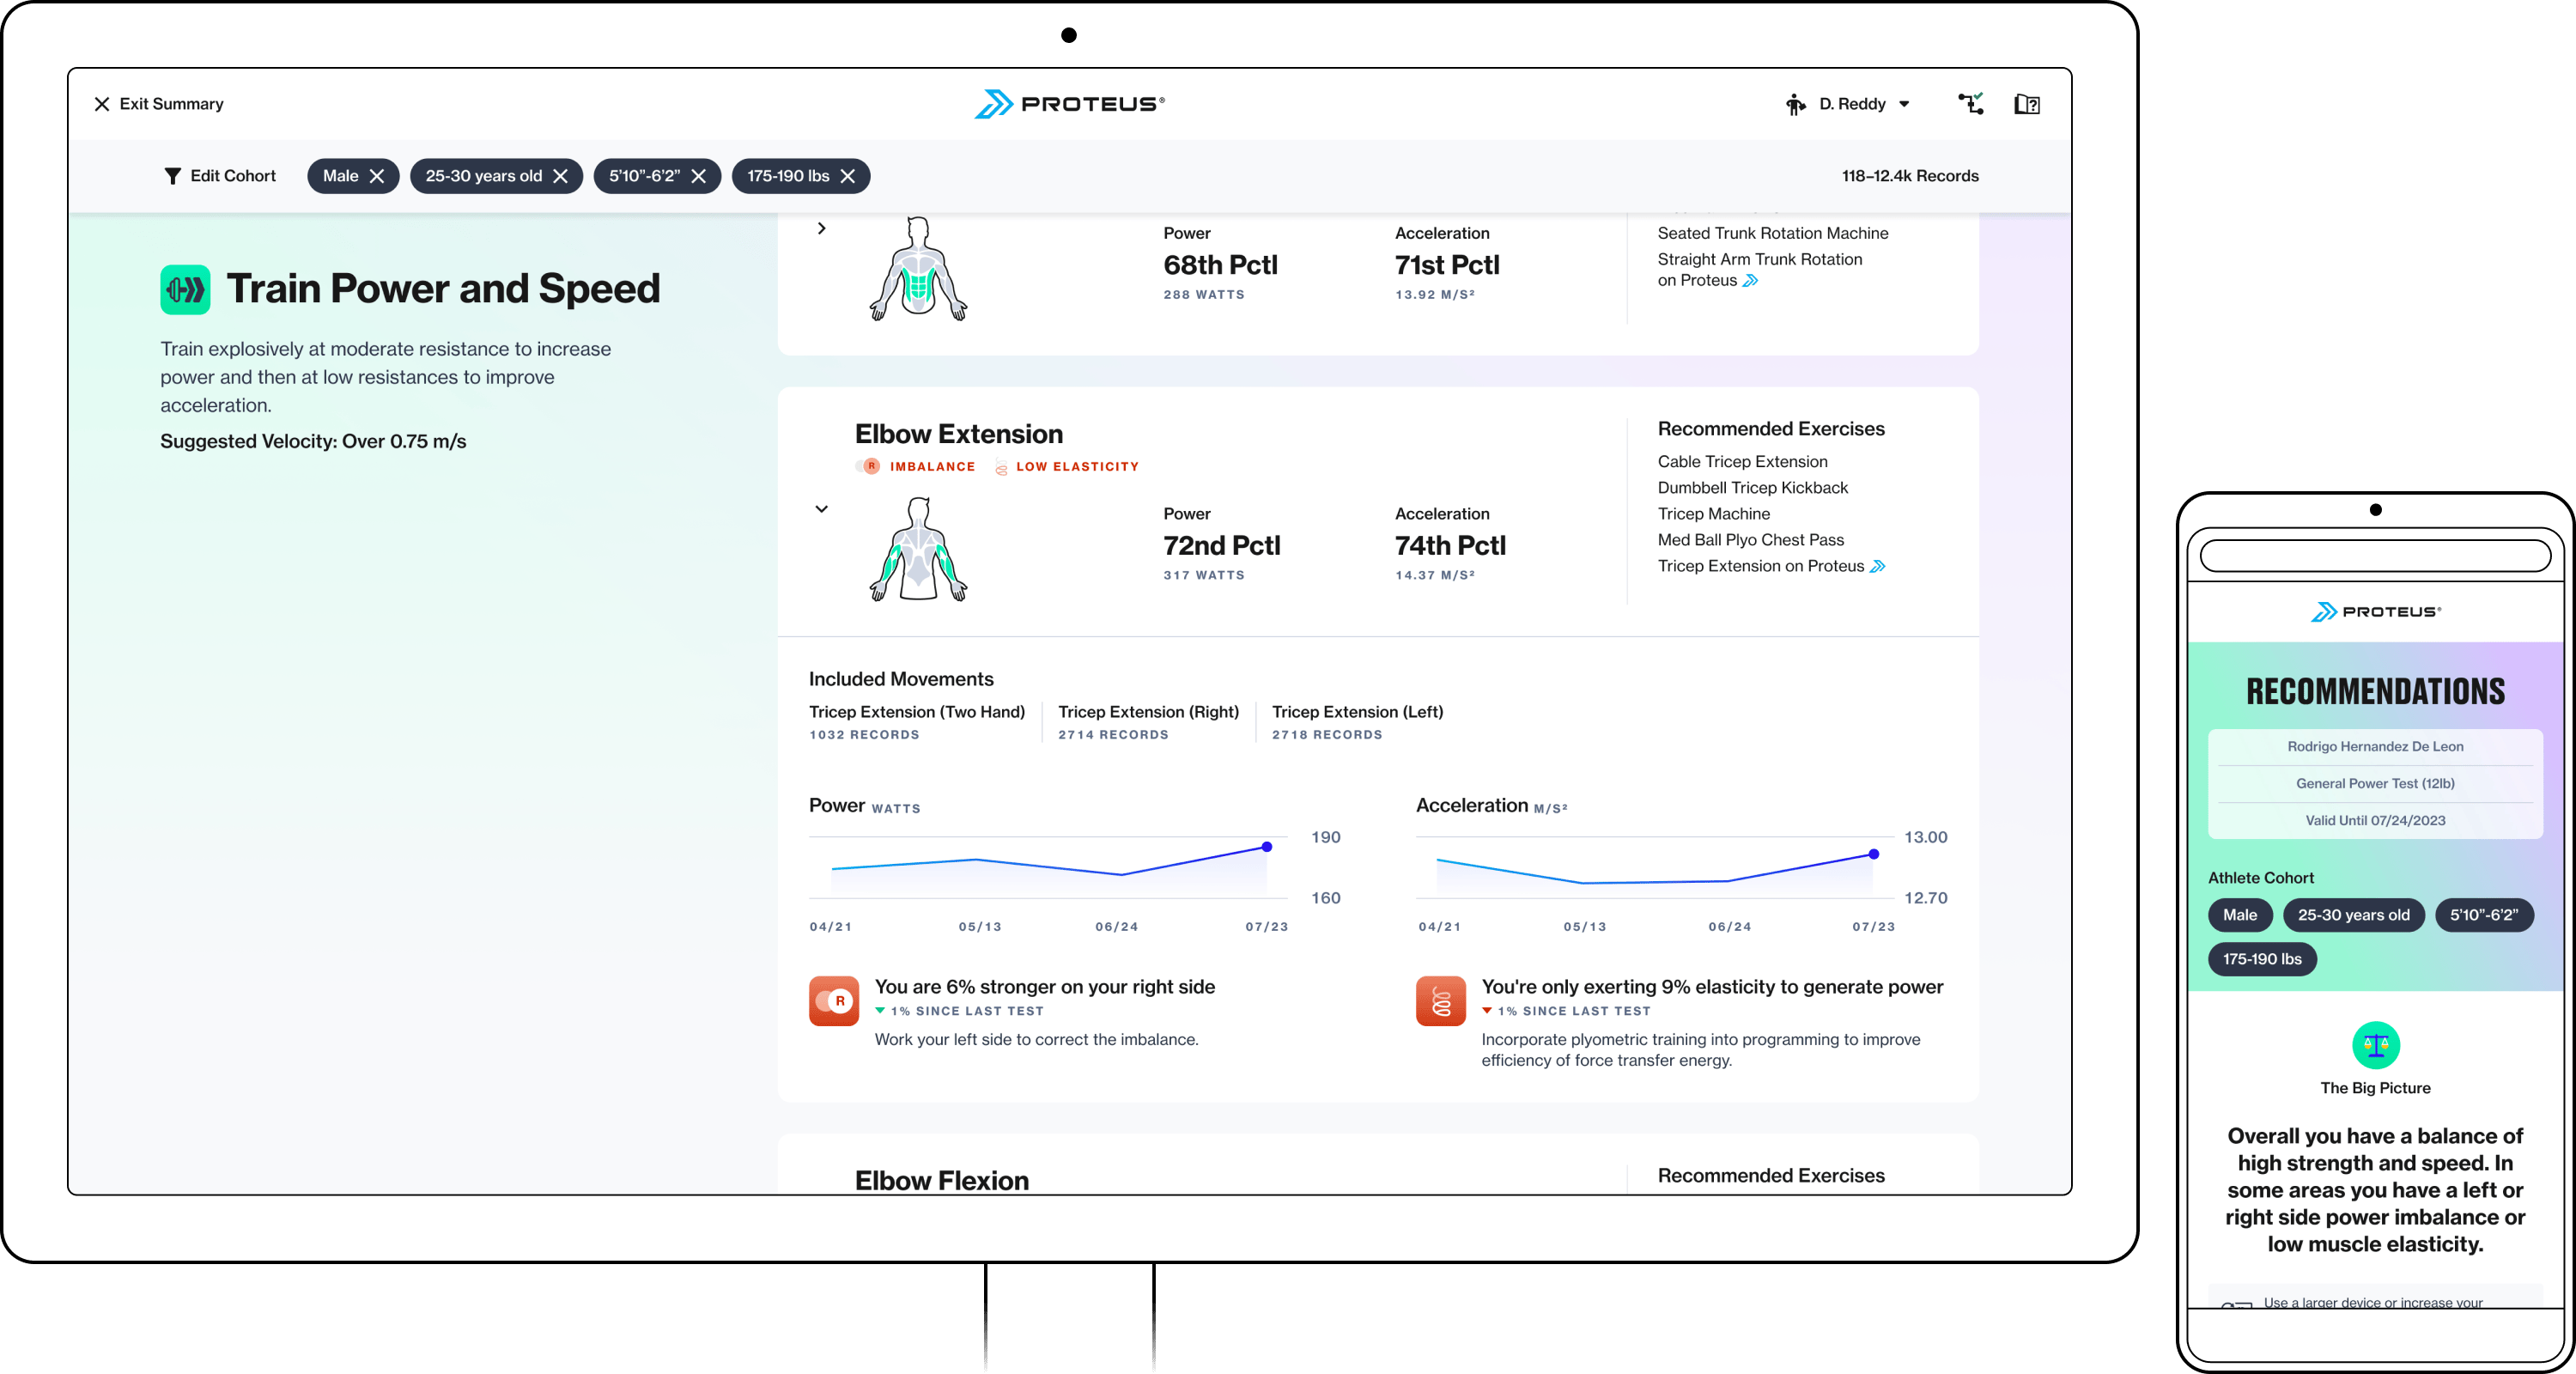
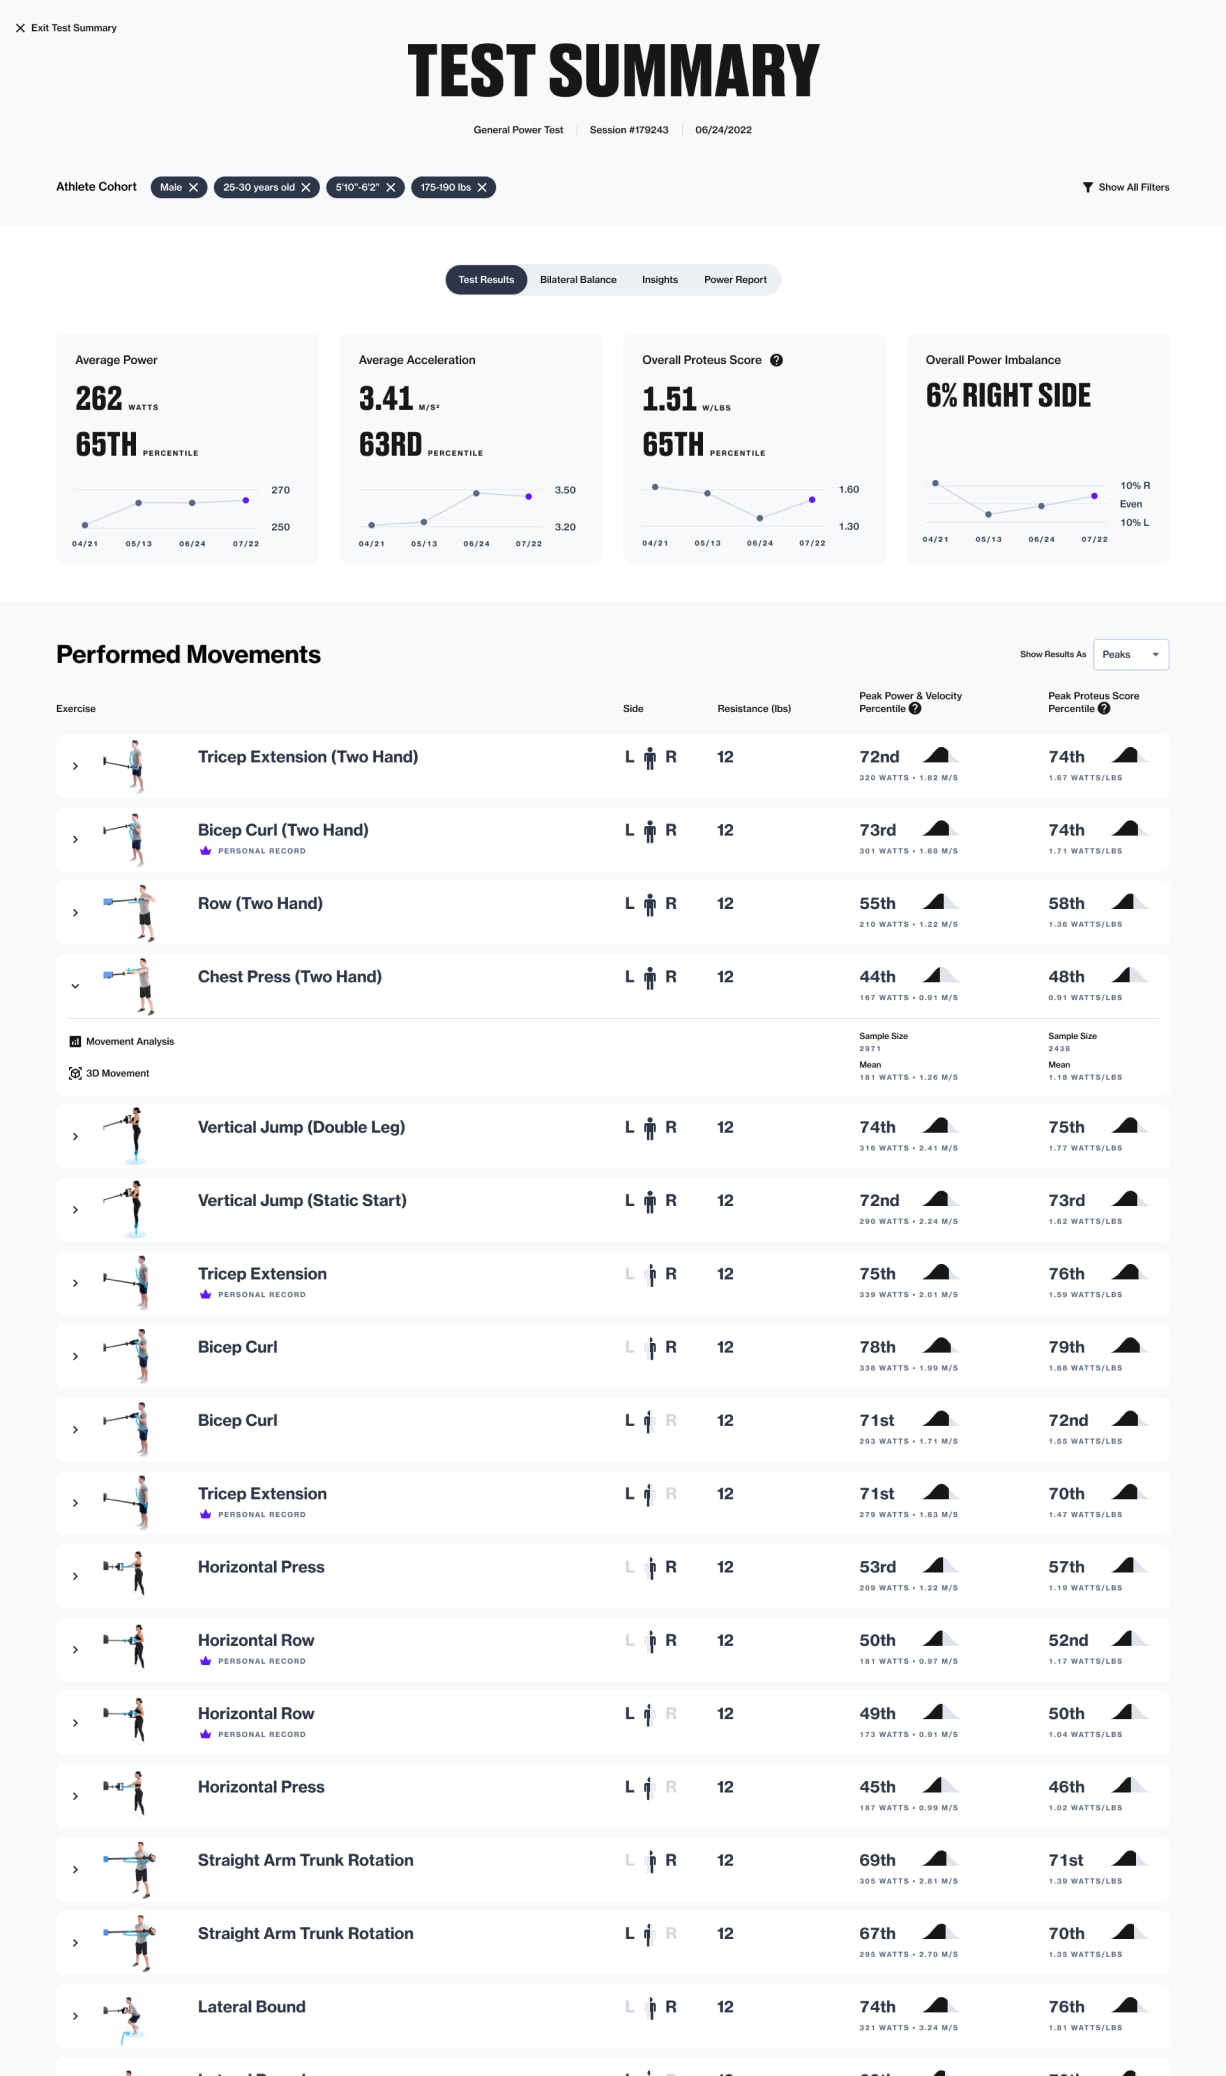
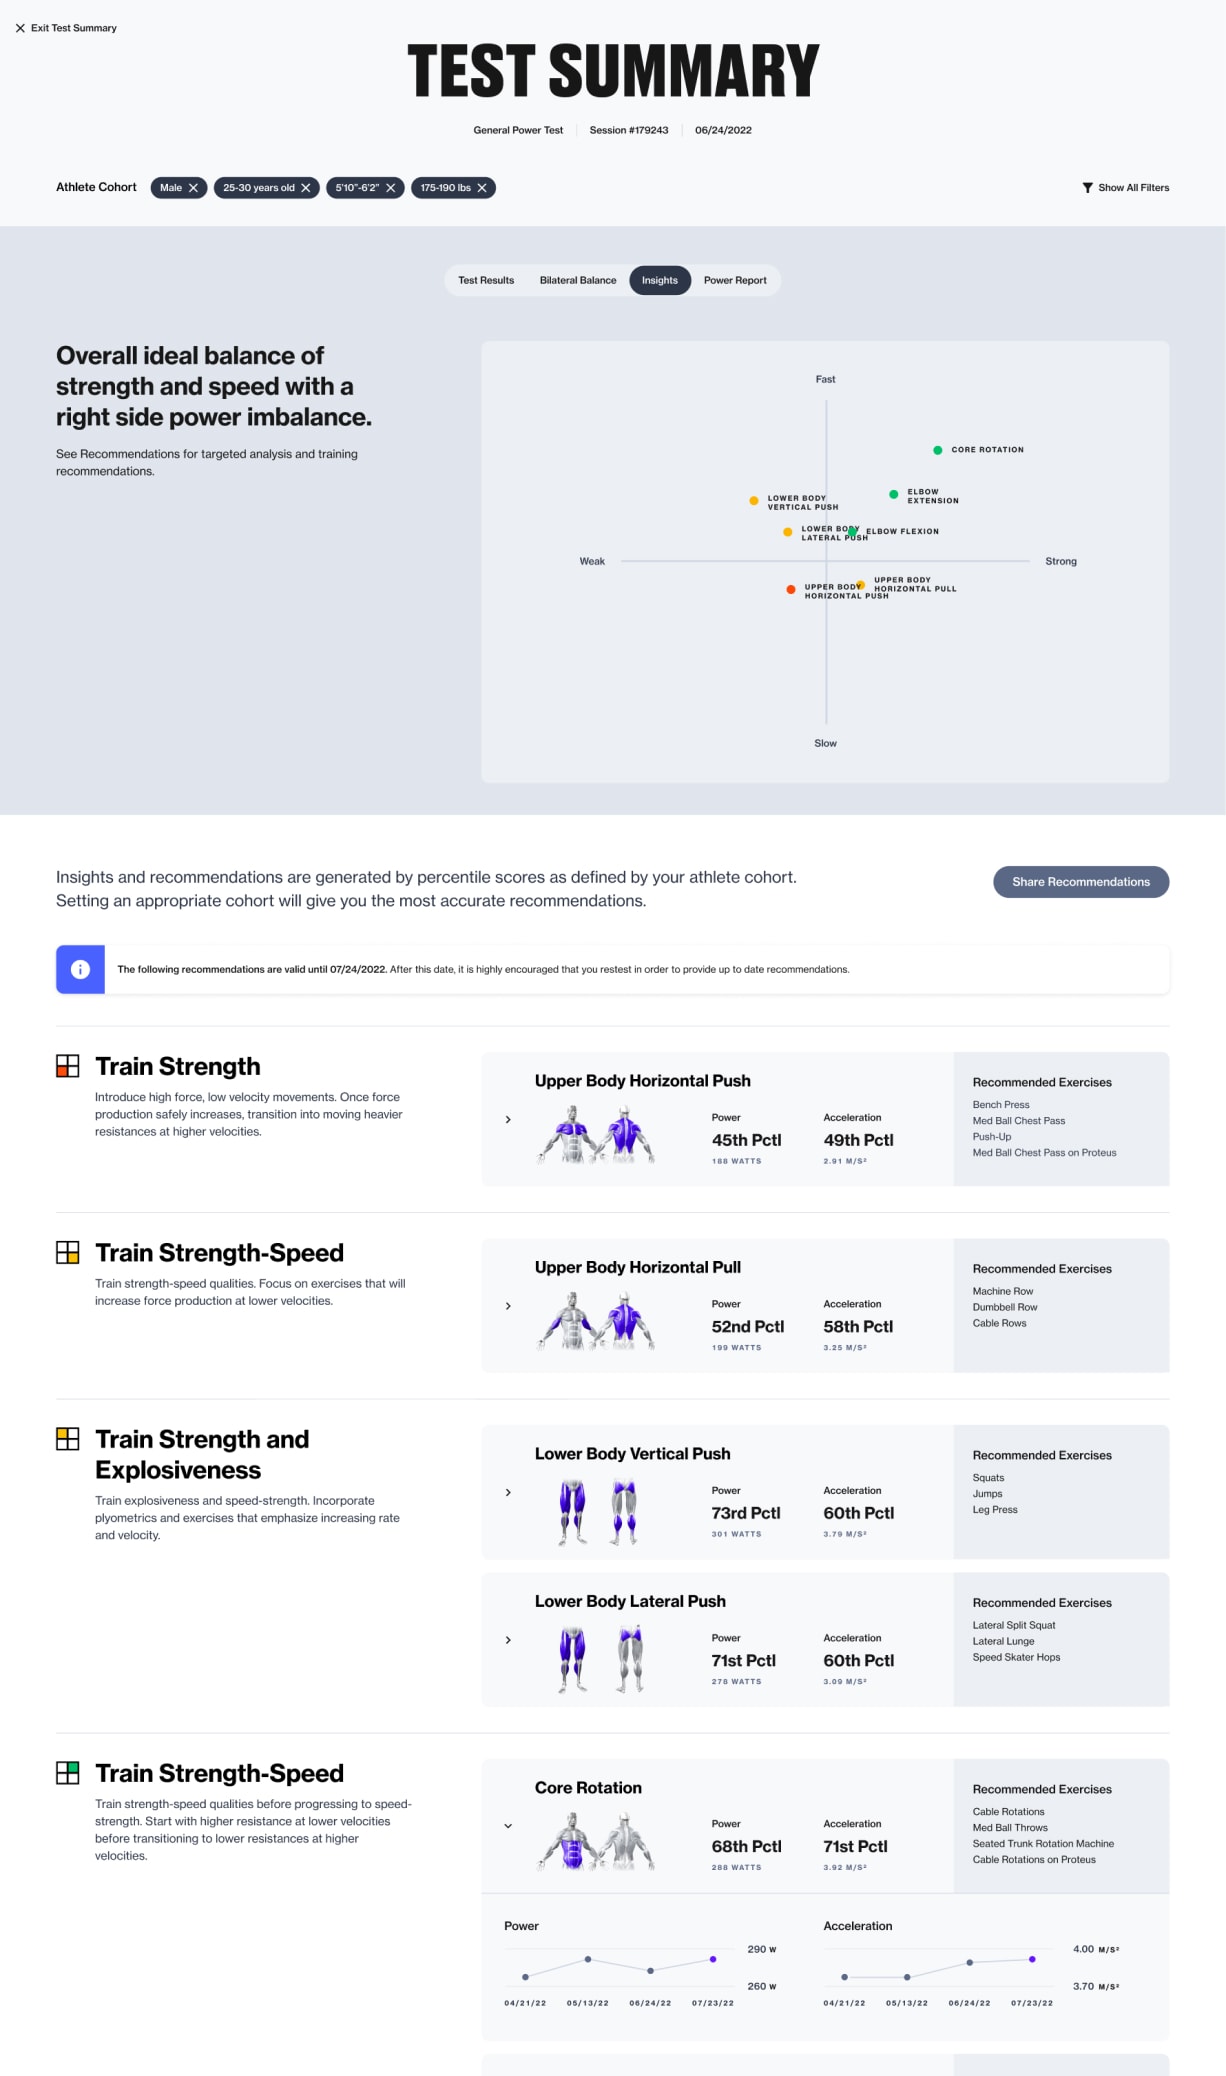
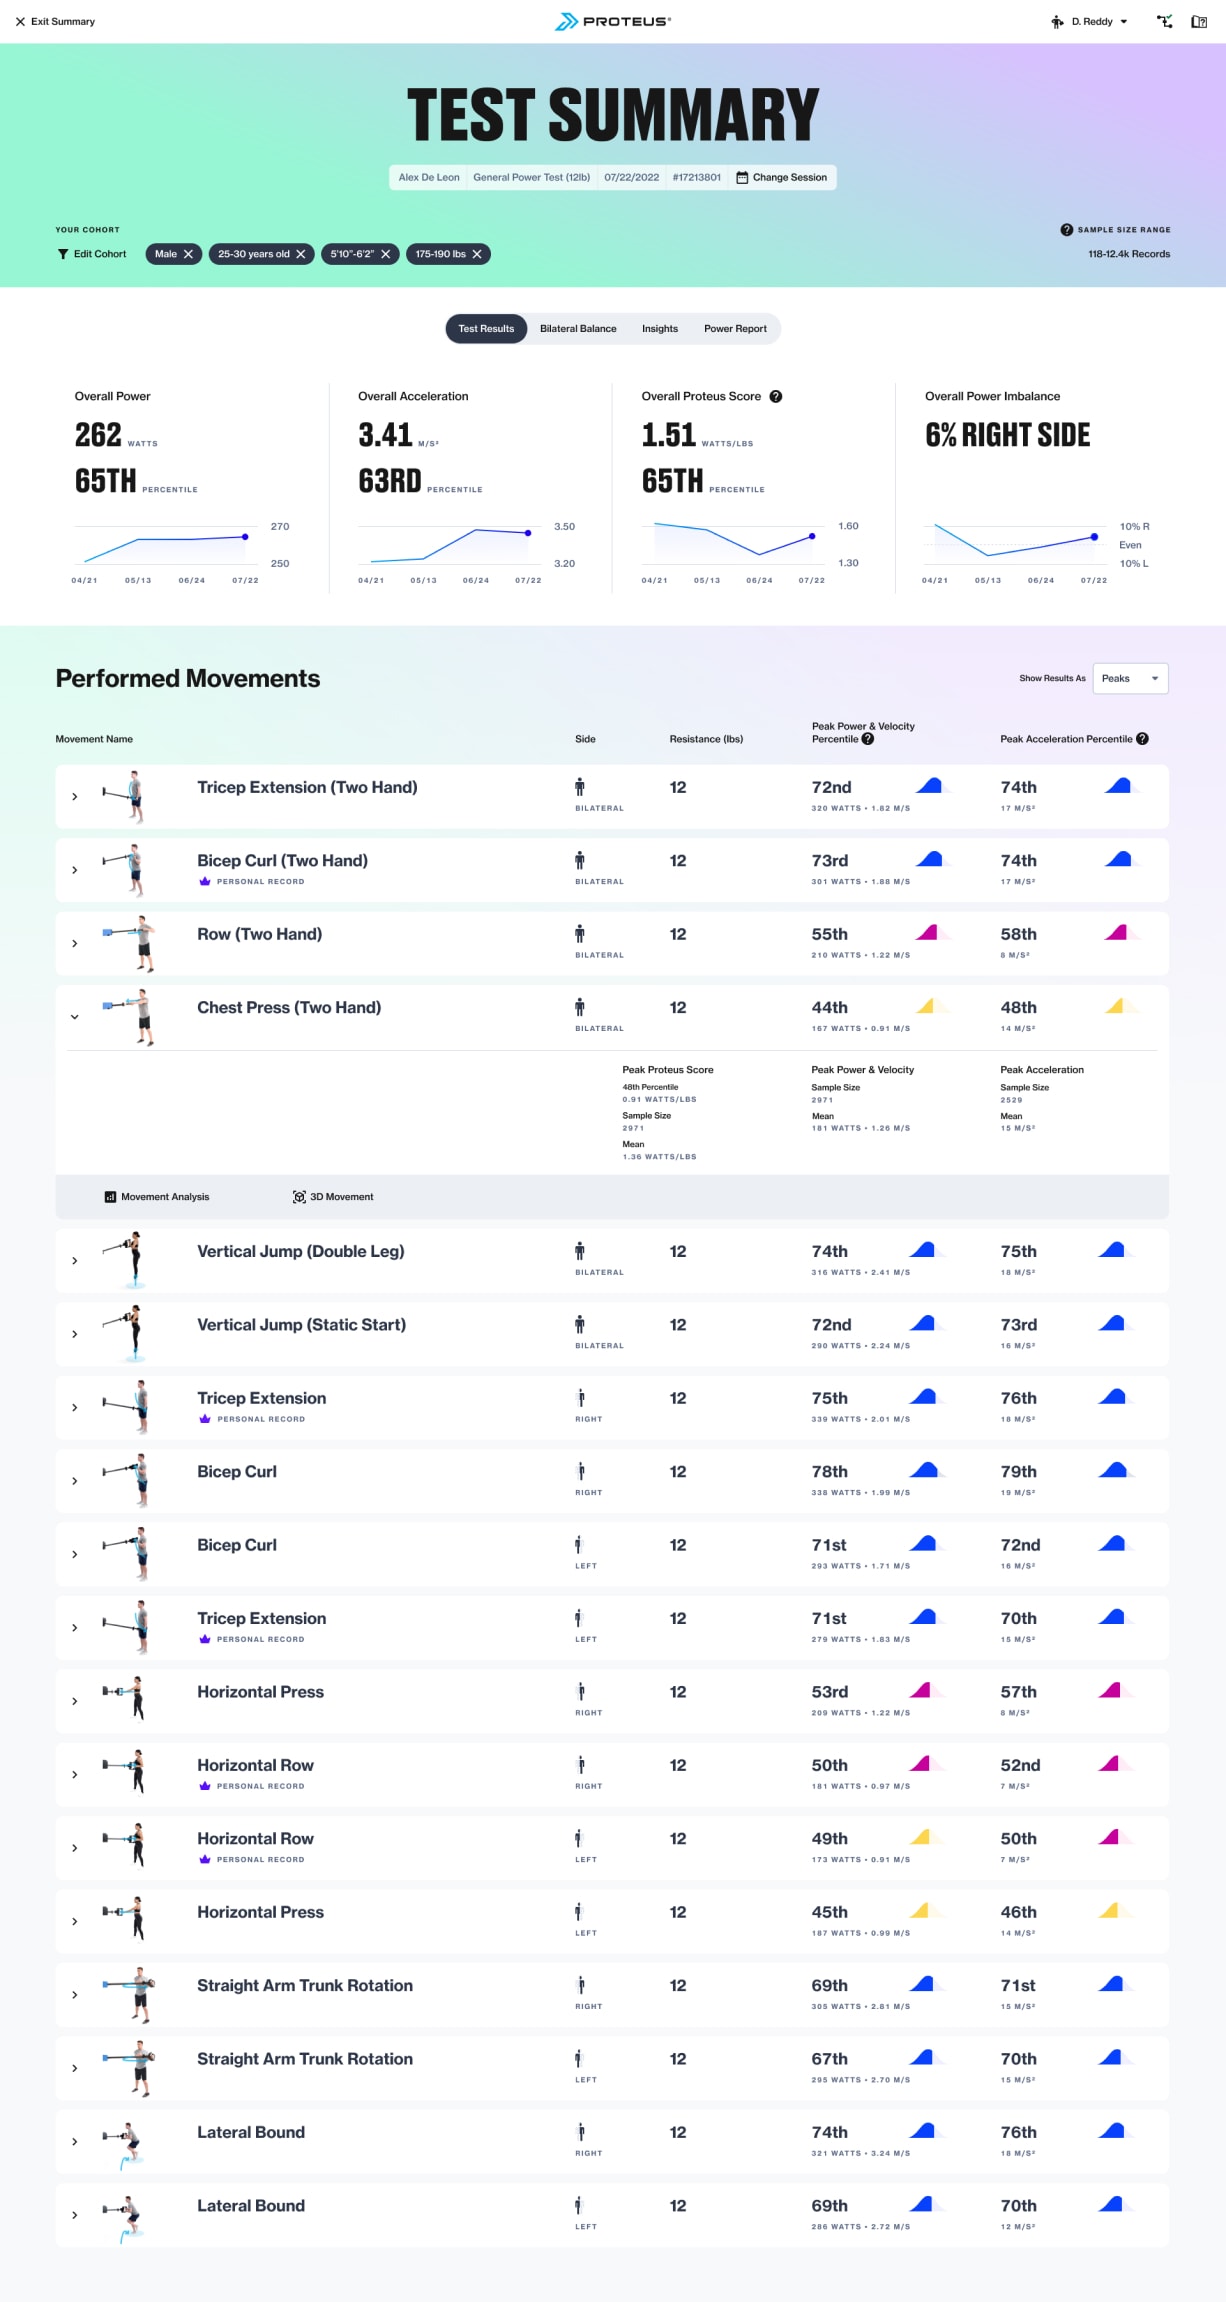
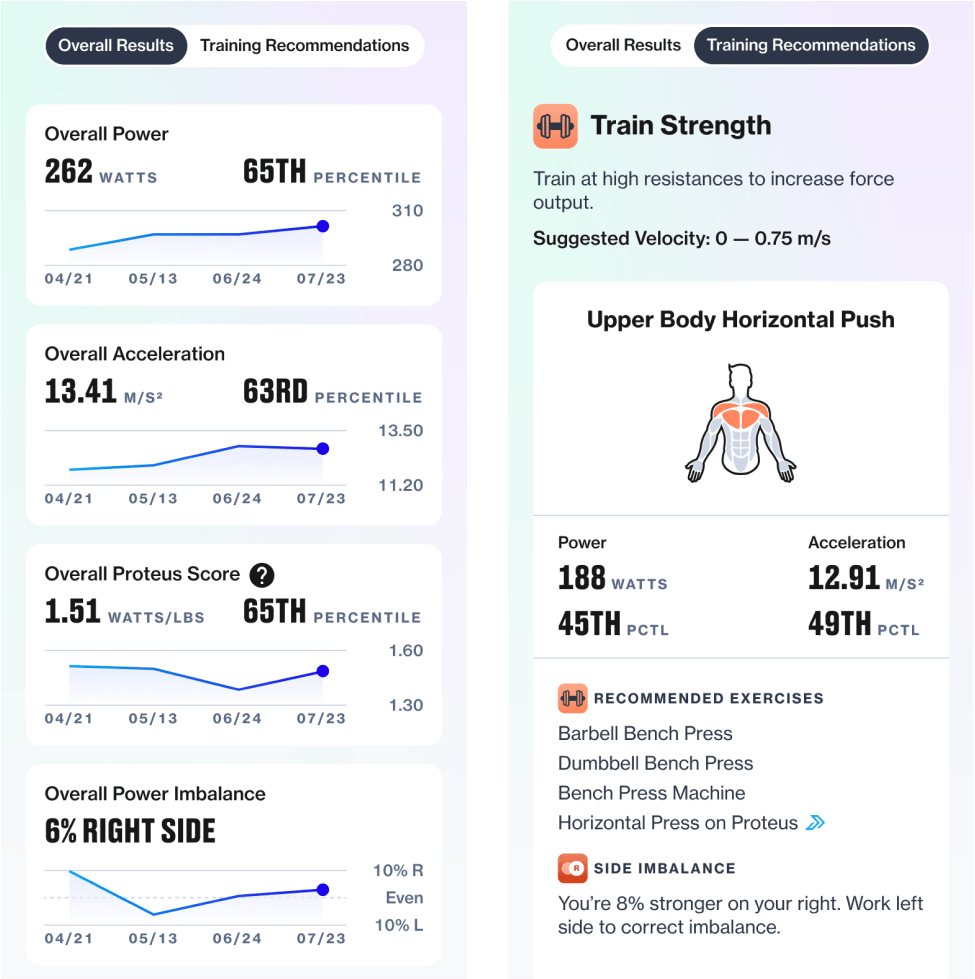
I used our research findings to consolidate high-affinity ideas from the concepts into a single wireframe direction. This design segmented data and analysis into 2-4 views (depending on the test, the Bilateral Balance or Power Report view might not be available). The default view, Test Results, presented raw data and cohort-derived percentiles for the overall test and each movement. Insights provided simple analysis to understand power imbalances or deficiencies in power or acceleration. Below that, trainers received guidance on applying the results to their client’s training program. Based on power and acceleration scores, each movement category was categorized into one of four training adaptations, along with recommended exercises. Trainers could easily share recommendations with clients through a simplified mobile-friendly training "pocket guide".
Test Results view
Insights view
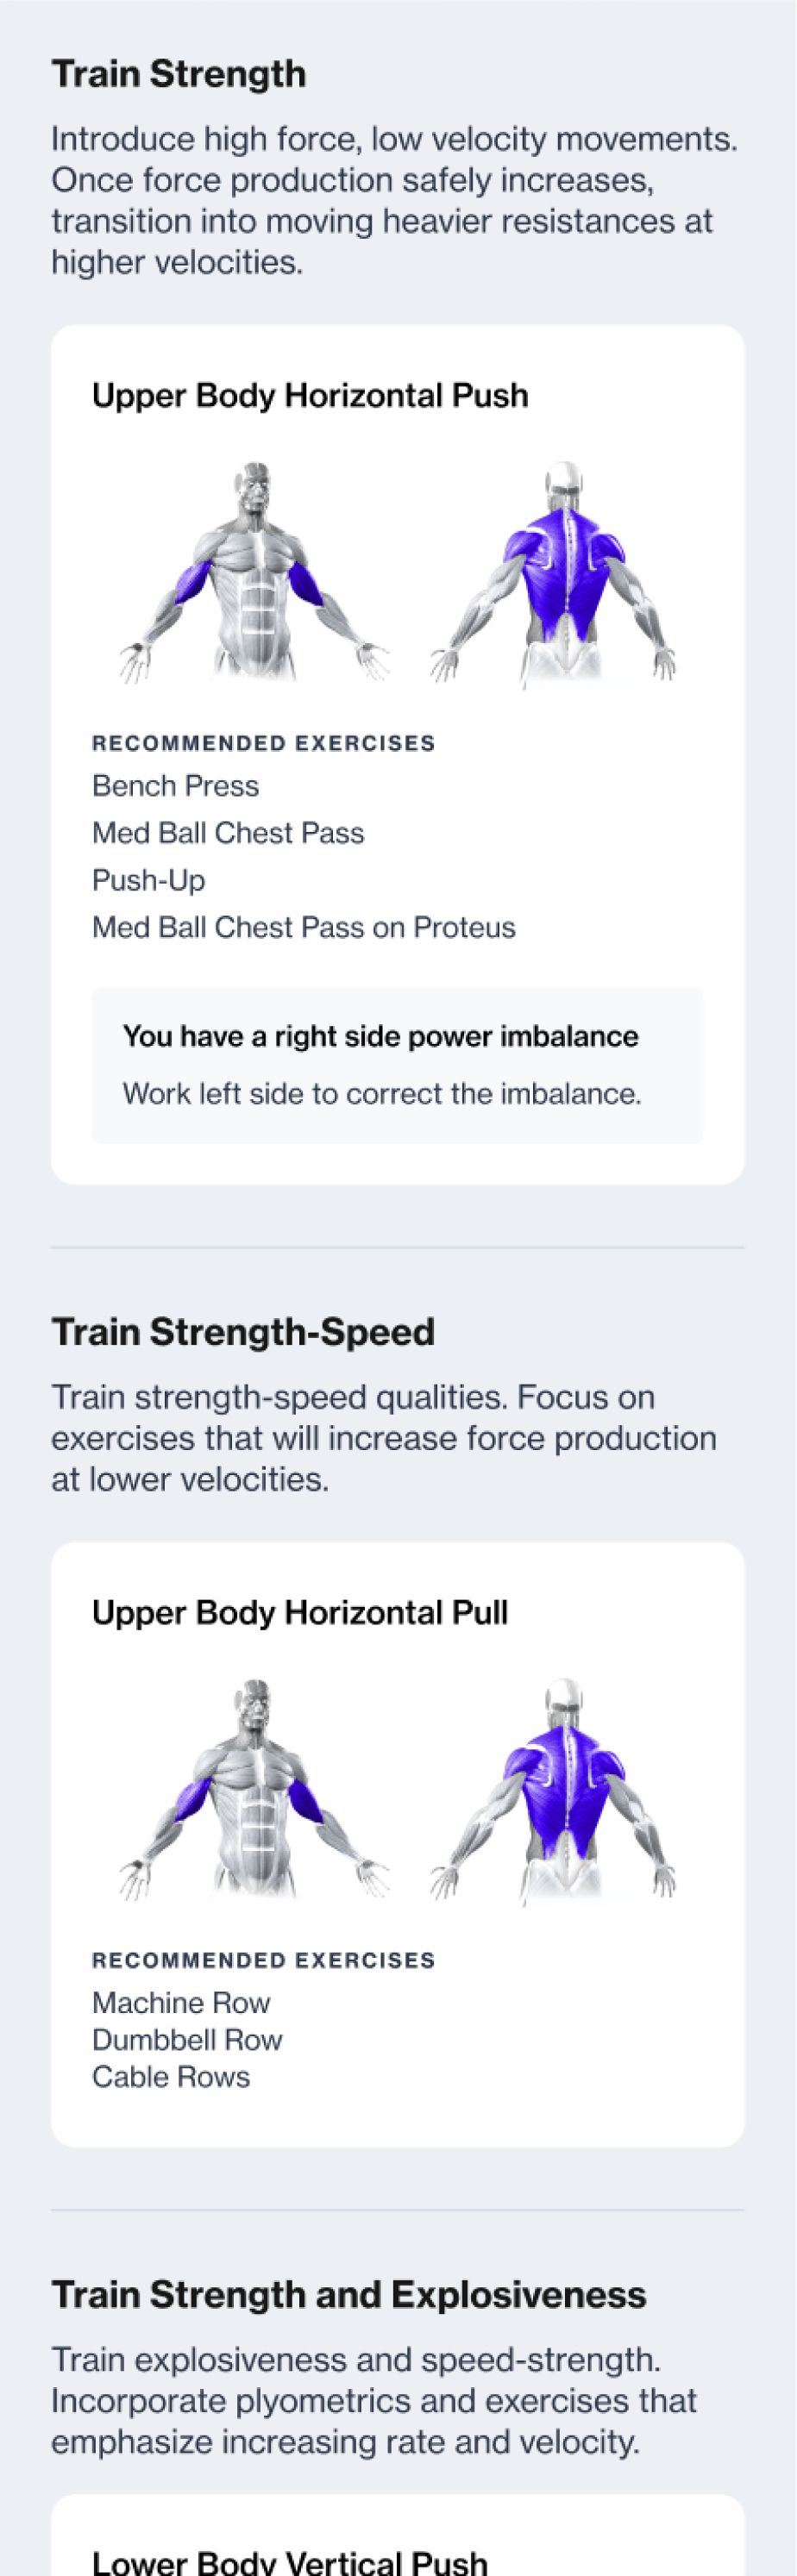
“Pocket Guide”
After stakeholder approval of the mid-fi wires, we proceeded with detailed design of the new experience. While I focused on new states (Test Results, Insights, “Pocket Guide”), my designer handled holdover views (Power Report and Bilateral Balance) and progress graphing styles.
Two interface elements posed challenges. The movement category cards conveyed key metrics, progress, and training recommendations. While testing, users could skip movements, add sets, or adjust resistance, potentially deviating from the standardized test and breaking our ability to show progress over time. This required a number of permutations to the card design to handle these edge cases.
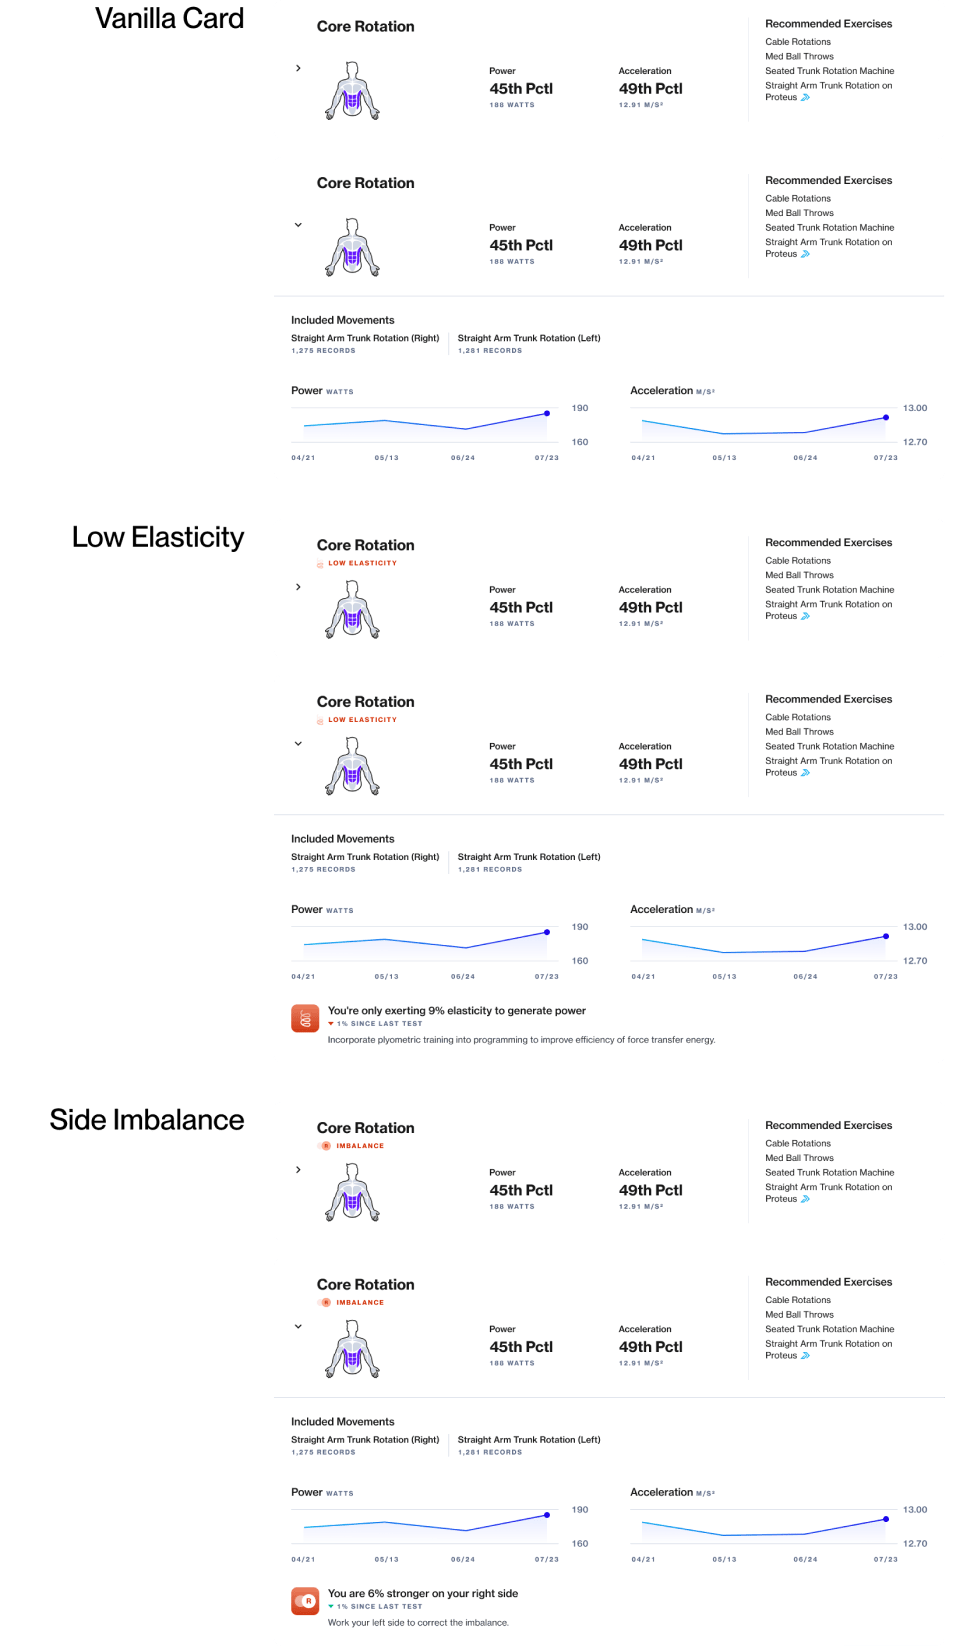
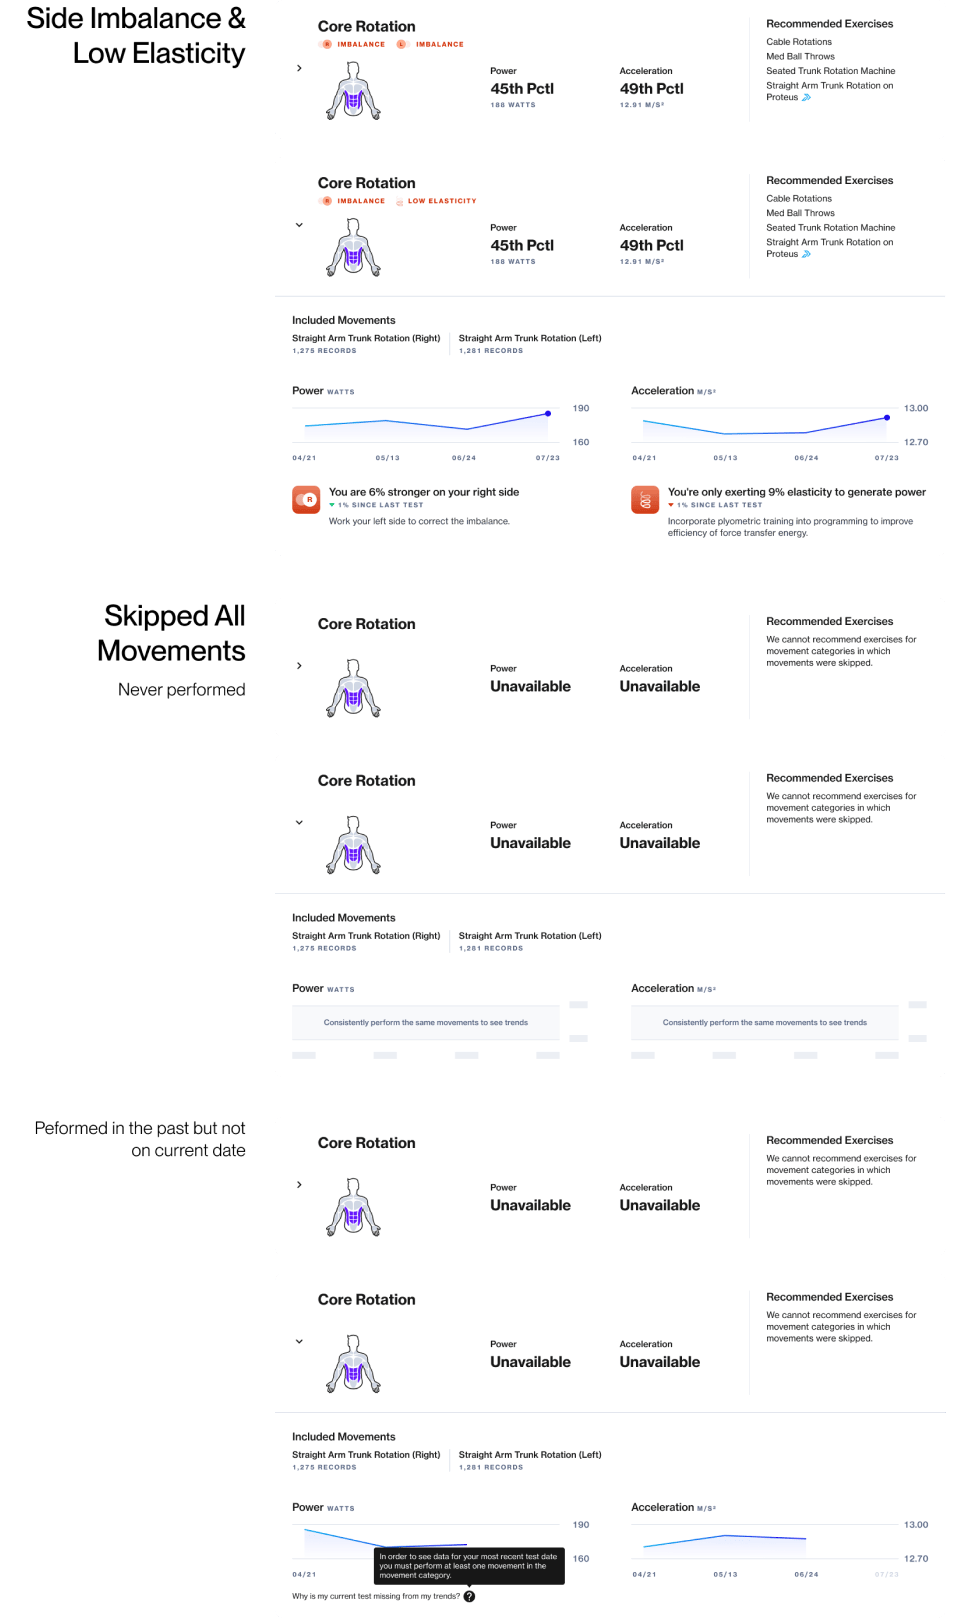
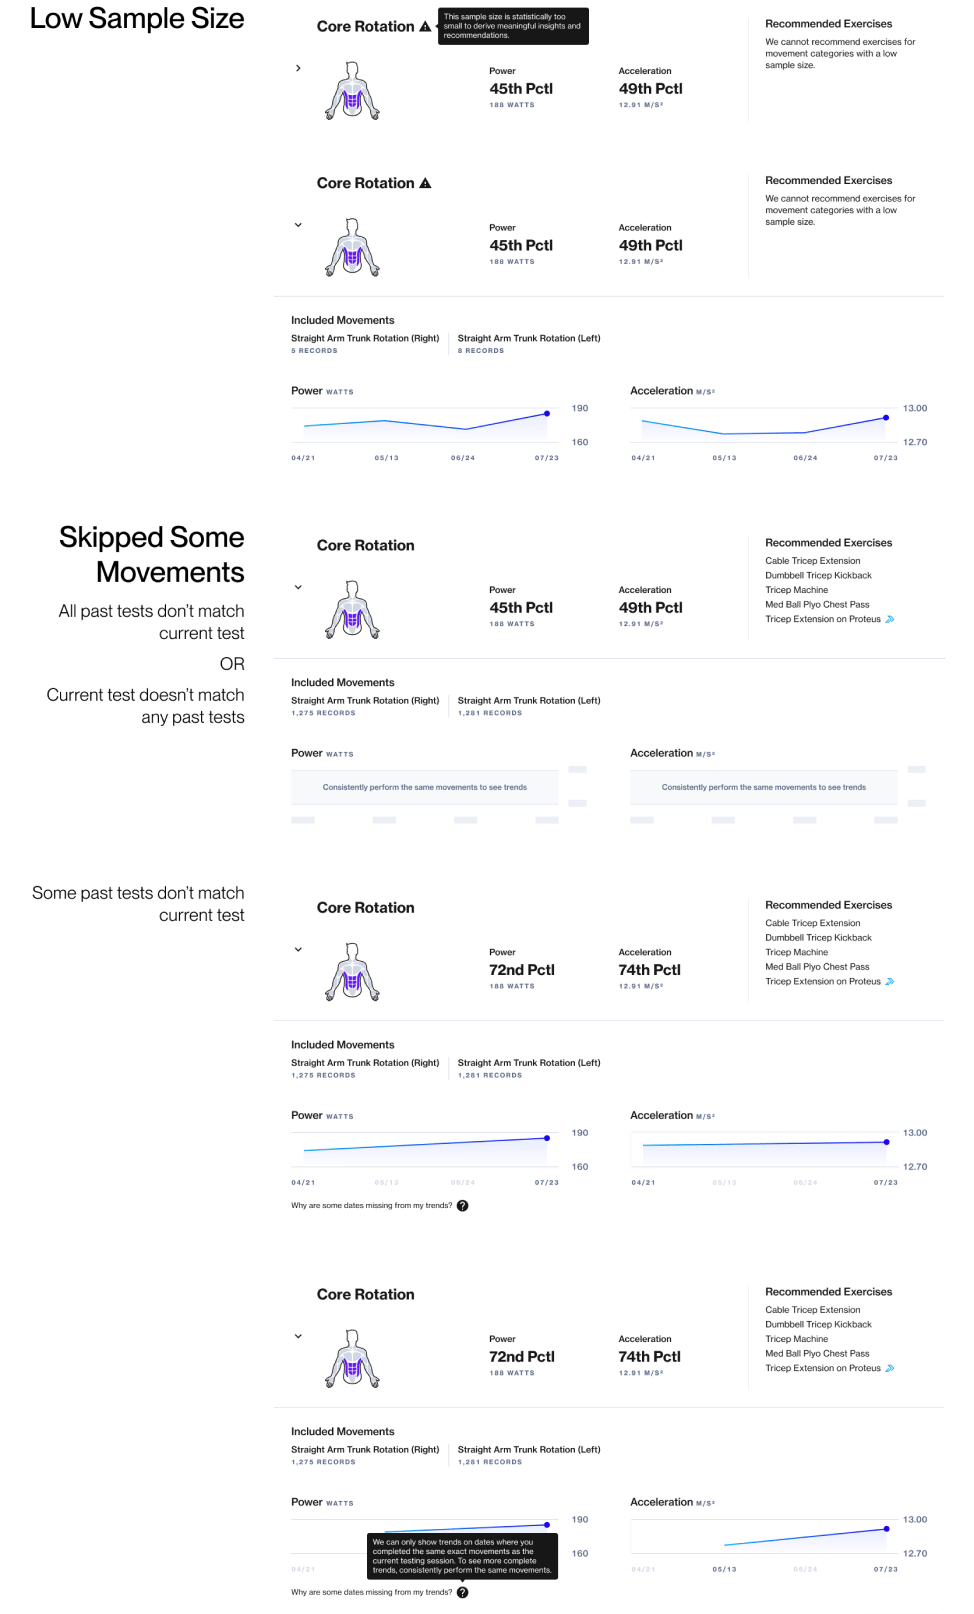
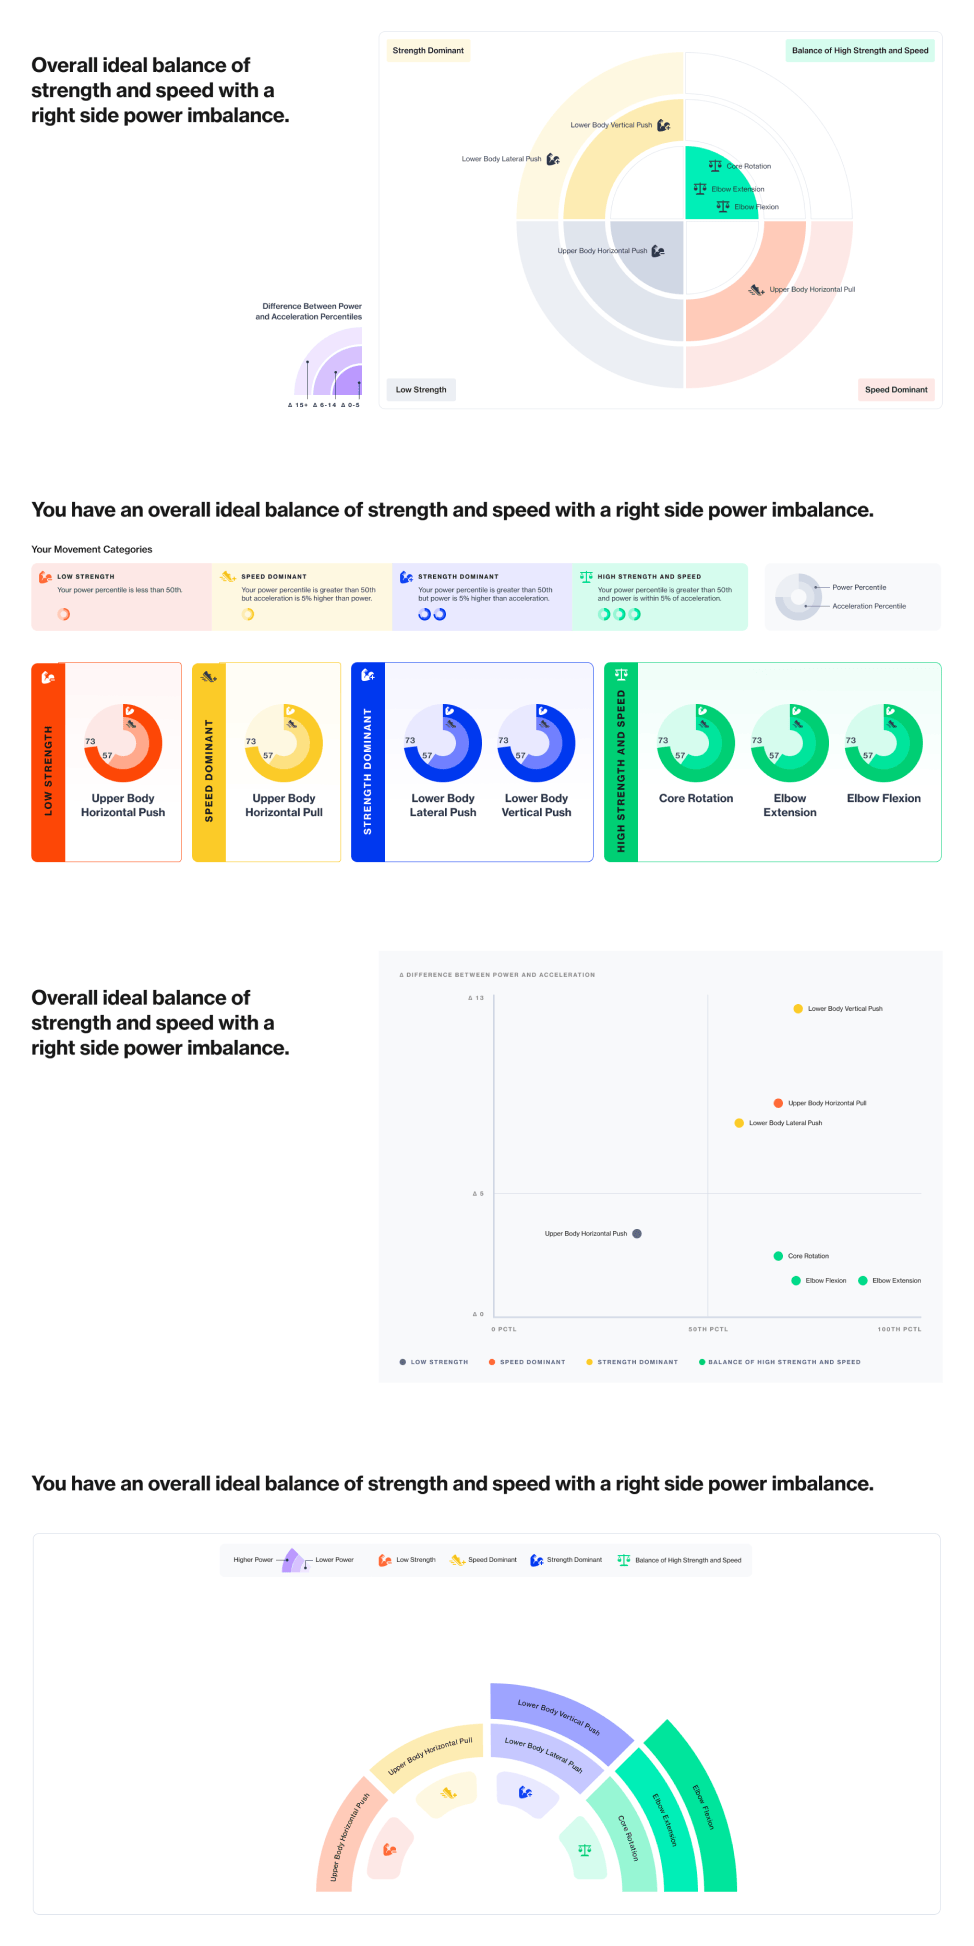
Before diving into detailed recommendations in the movement category cards, we aimed to quickly offer users a high-level understanding of each category's classification. I proposed a simple visualization for instant comprehension. Creating this "hero" visualization posed challenges in balancing stakeholder requests for utility and marketability with user-centric concerns like immediate understandability and personal relevance. My designer and I explored over 30 directions, reconciling conflicting stakeholder desires while striving for user relevance and engineering feasibility. After quite a few unconventional directions, we reached a solution that satisfied all parties.
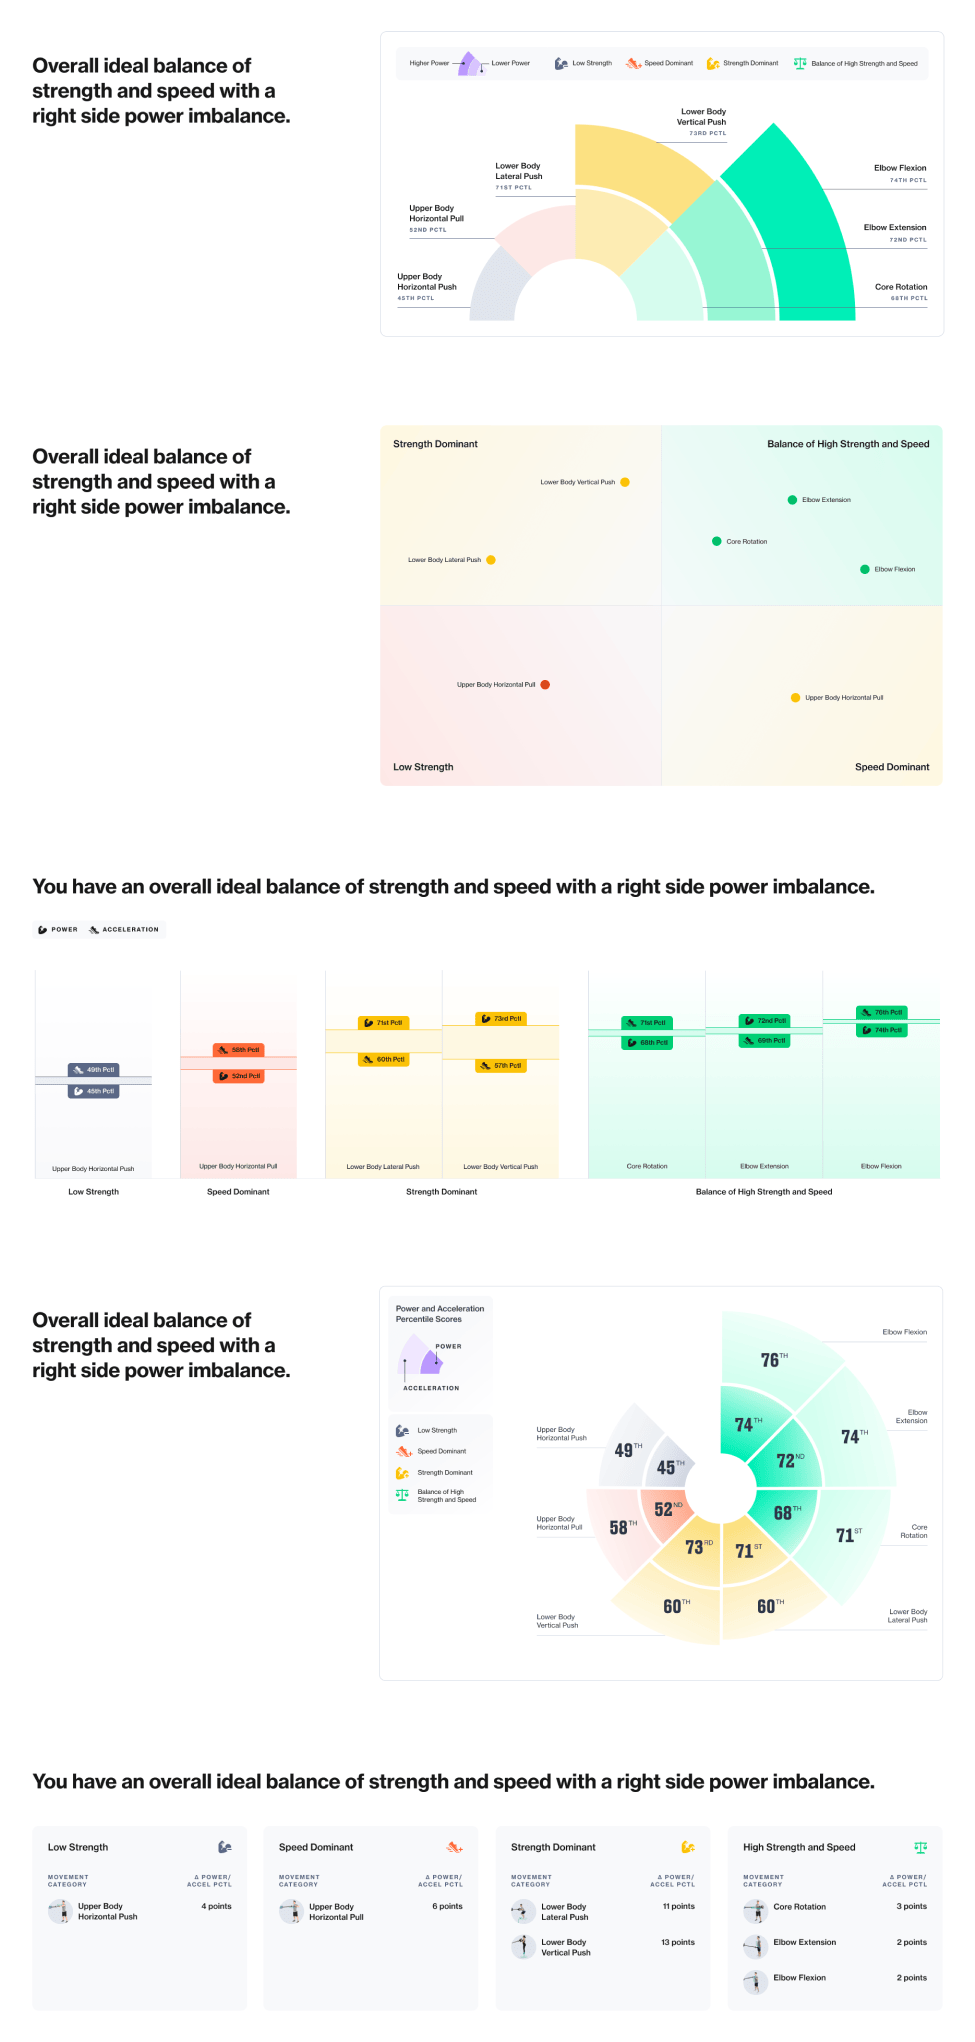
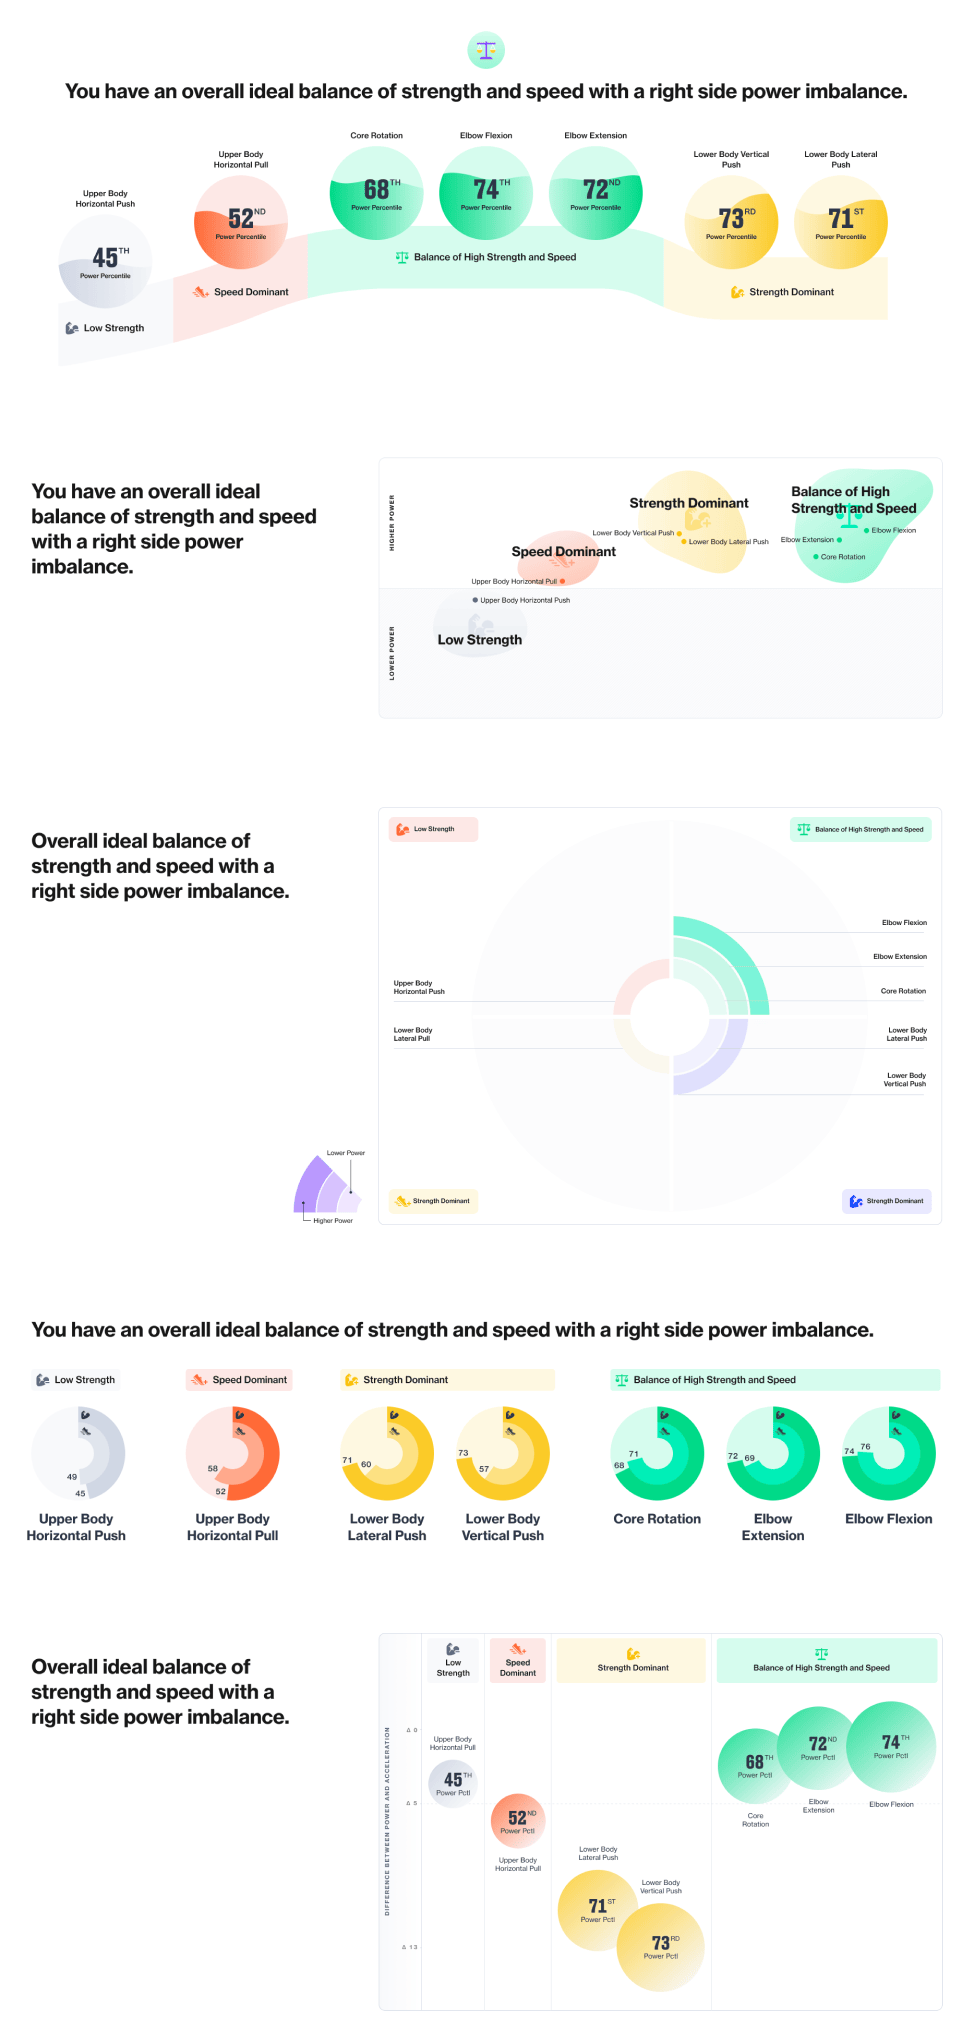
The detailed designs below reflect a more recent version than the original launch. While maintaining the original core features, these include added quality-of-life items like sample size ranges, contextual help content, and more precise training adaptation recommendations.
Overall test results by movement
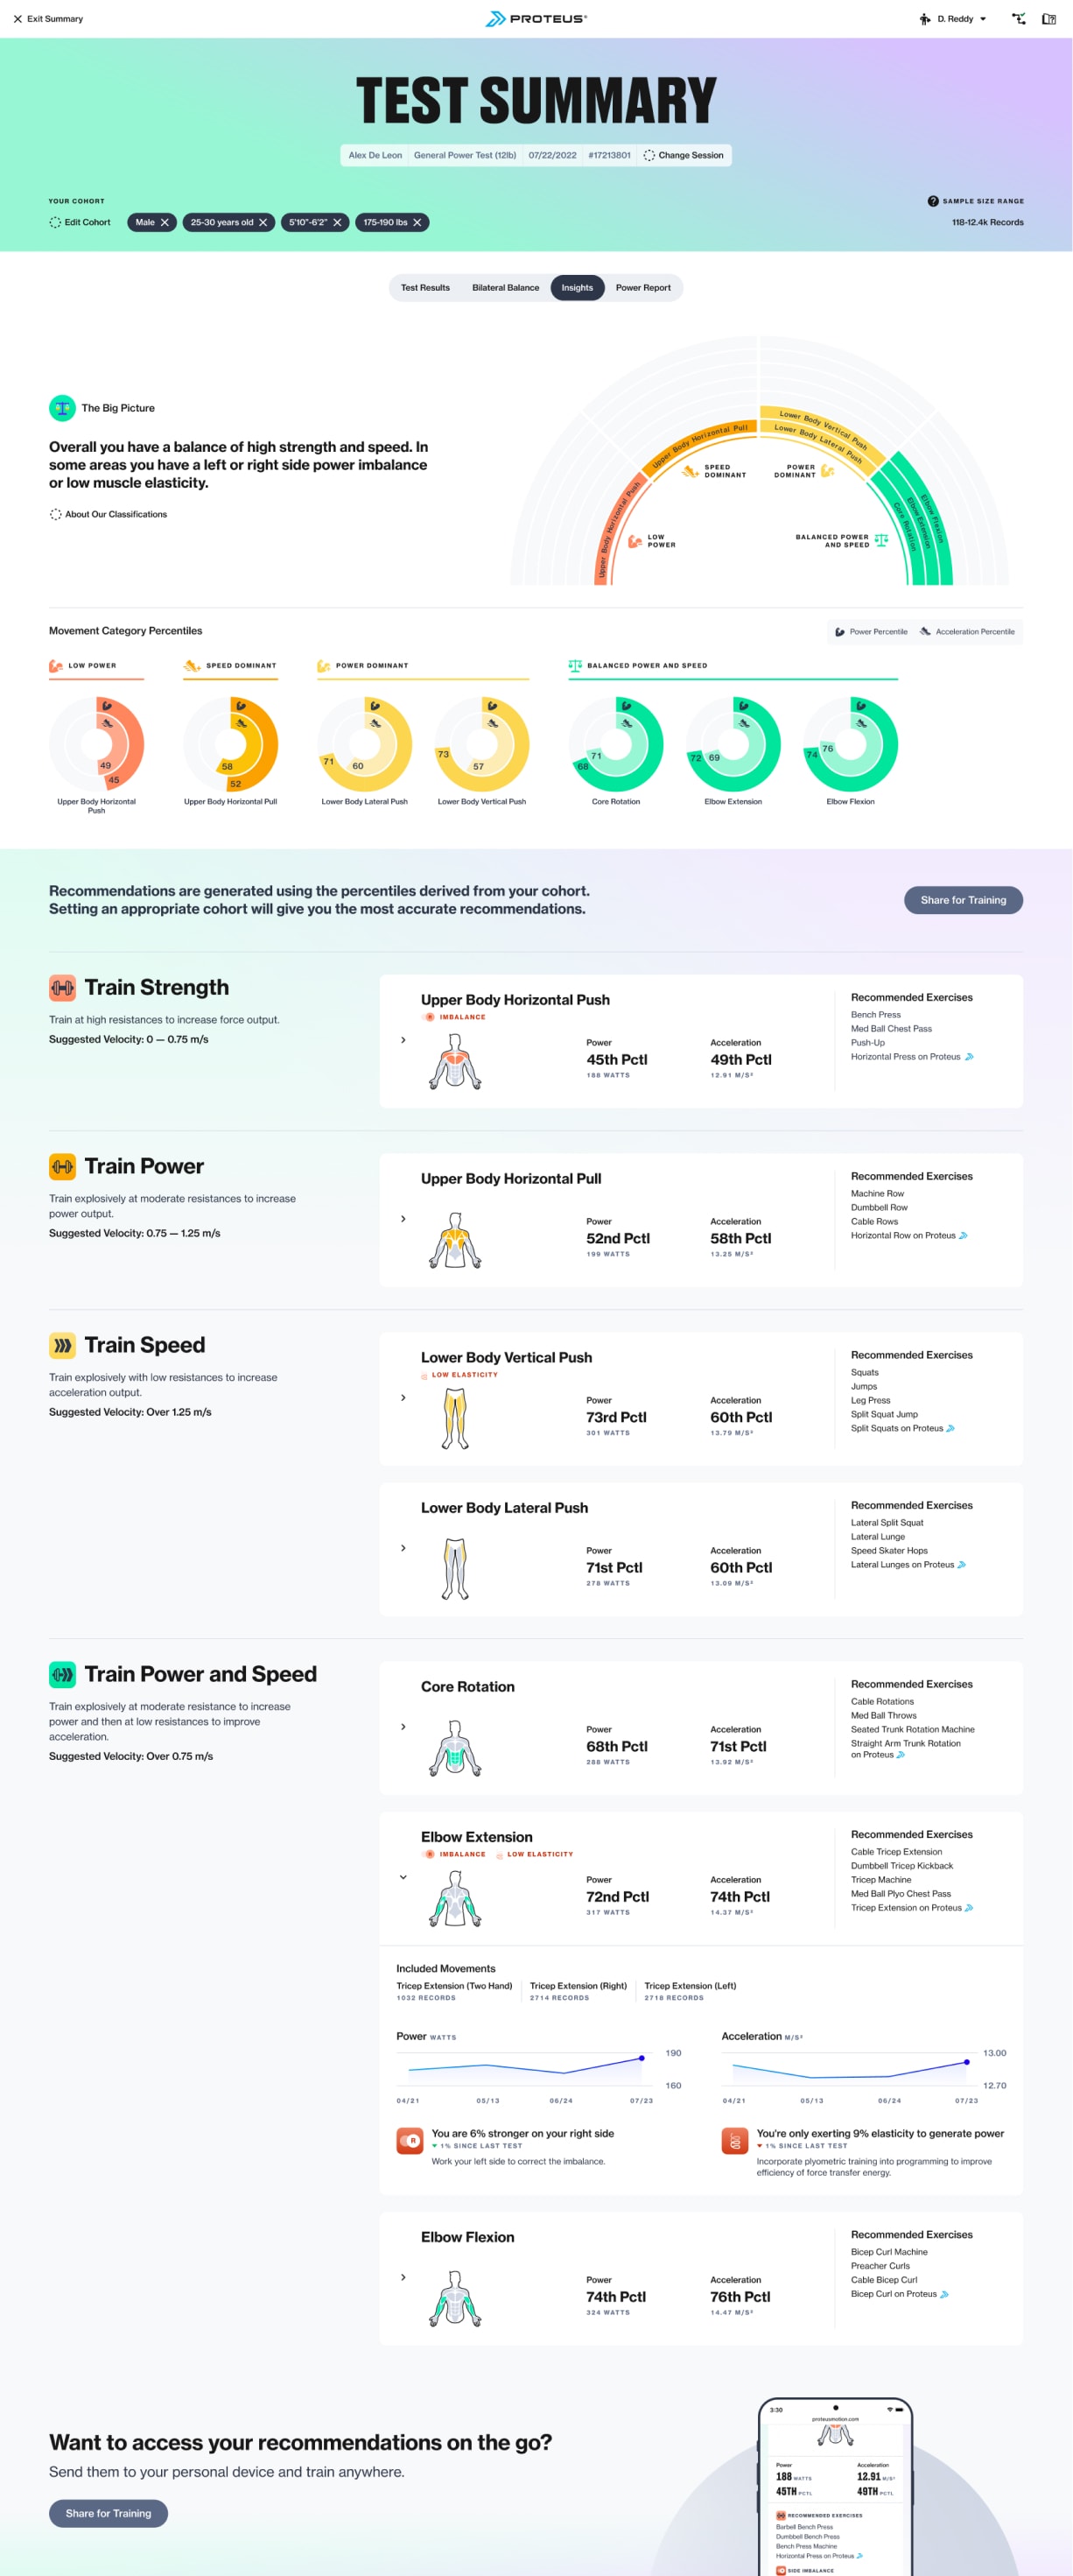
Insights and training recommendations
Provide a digital training guide for athletes to reference between tests
The final release for the new reporting experience was the "pocket guide," a streamlined view to make insights and recommendations easily accessible to athletes. While most views are optimized for the attached touchscreen, this would be the first fully responsive view, designed with a mobile-first approach.
Since most sites keep Proteus authenticated using a trainer's credentials, athletes typically don't need to log in.
"Supervised athletes" (like rehab patients or pro athletes) lack their own login credentials. To ensure all athletes could access their training recommendations, while also providing a modicum of data privacy the "pocket guide" is accessible via a long, obfuscated URL. Additionally, each shared recommendation link expires after 6 months to reduce unintended access.
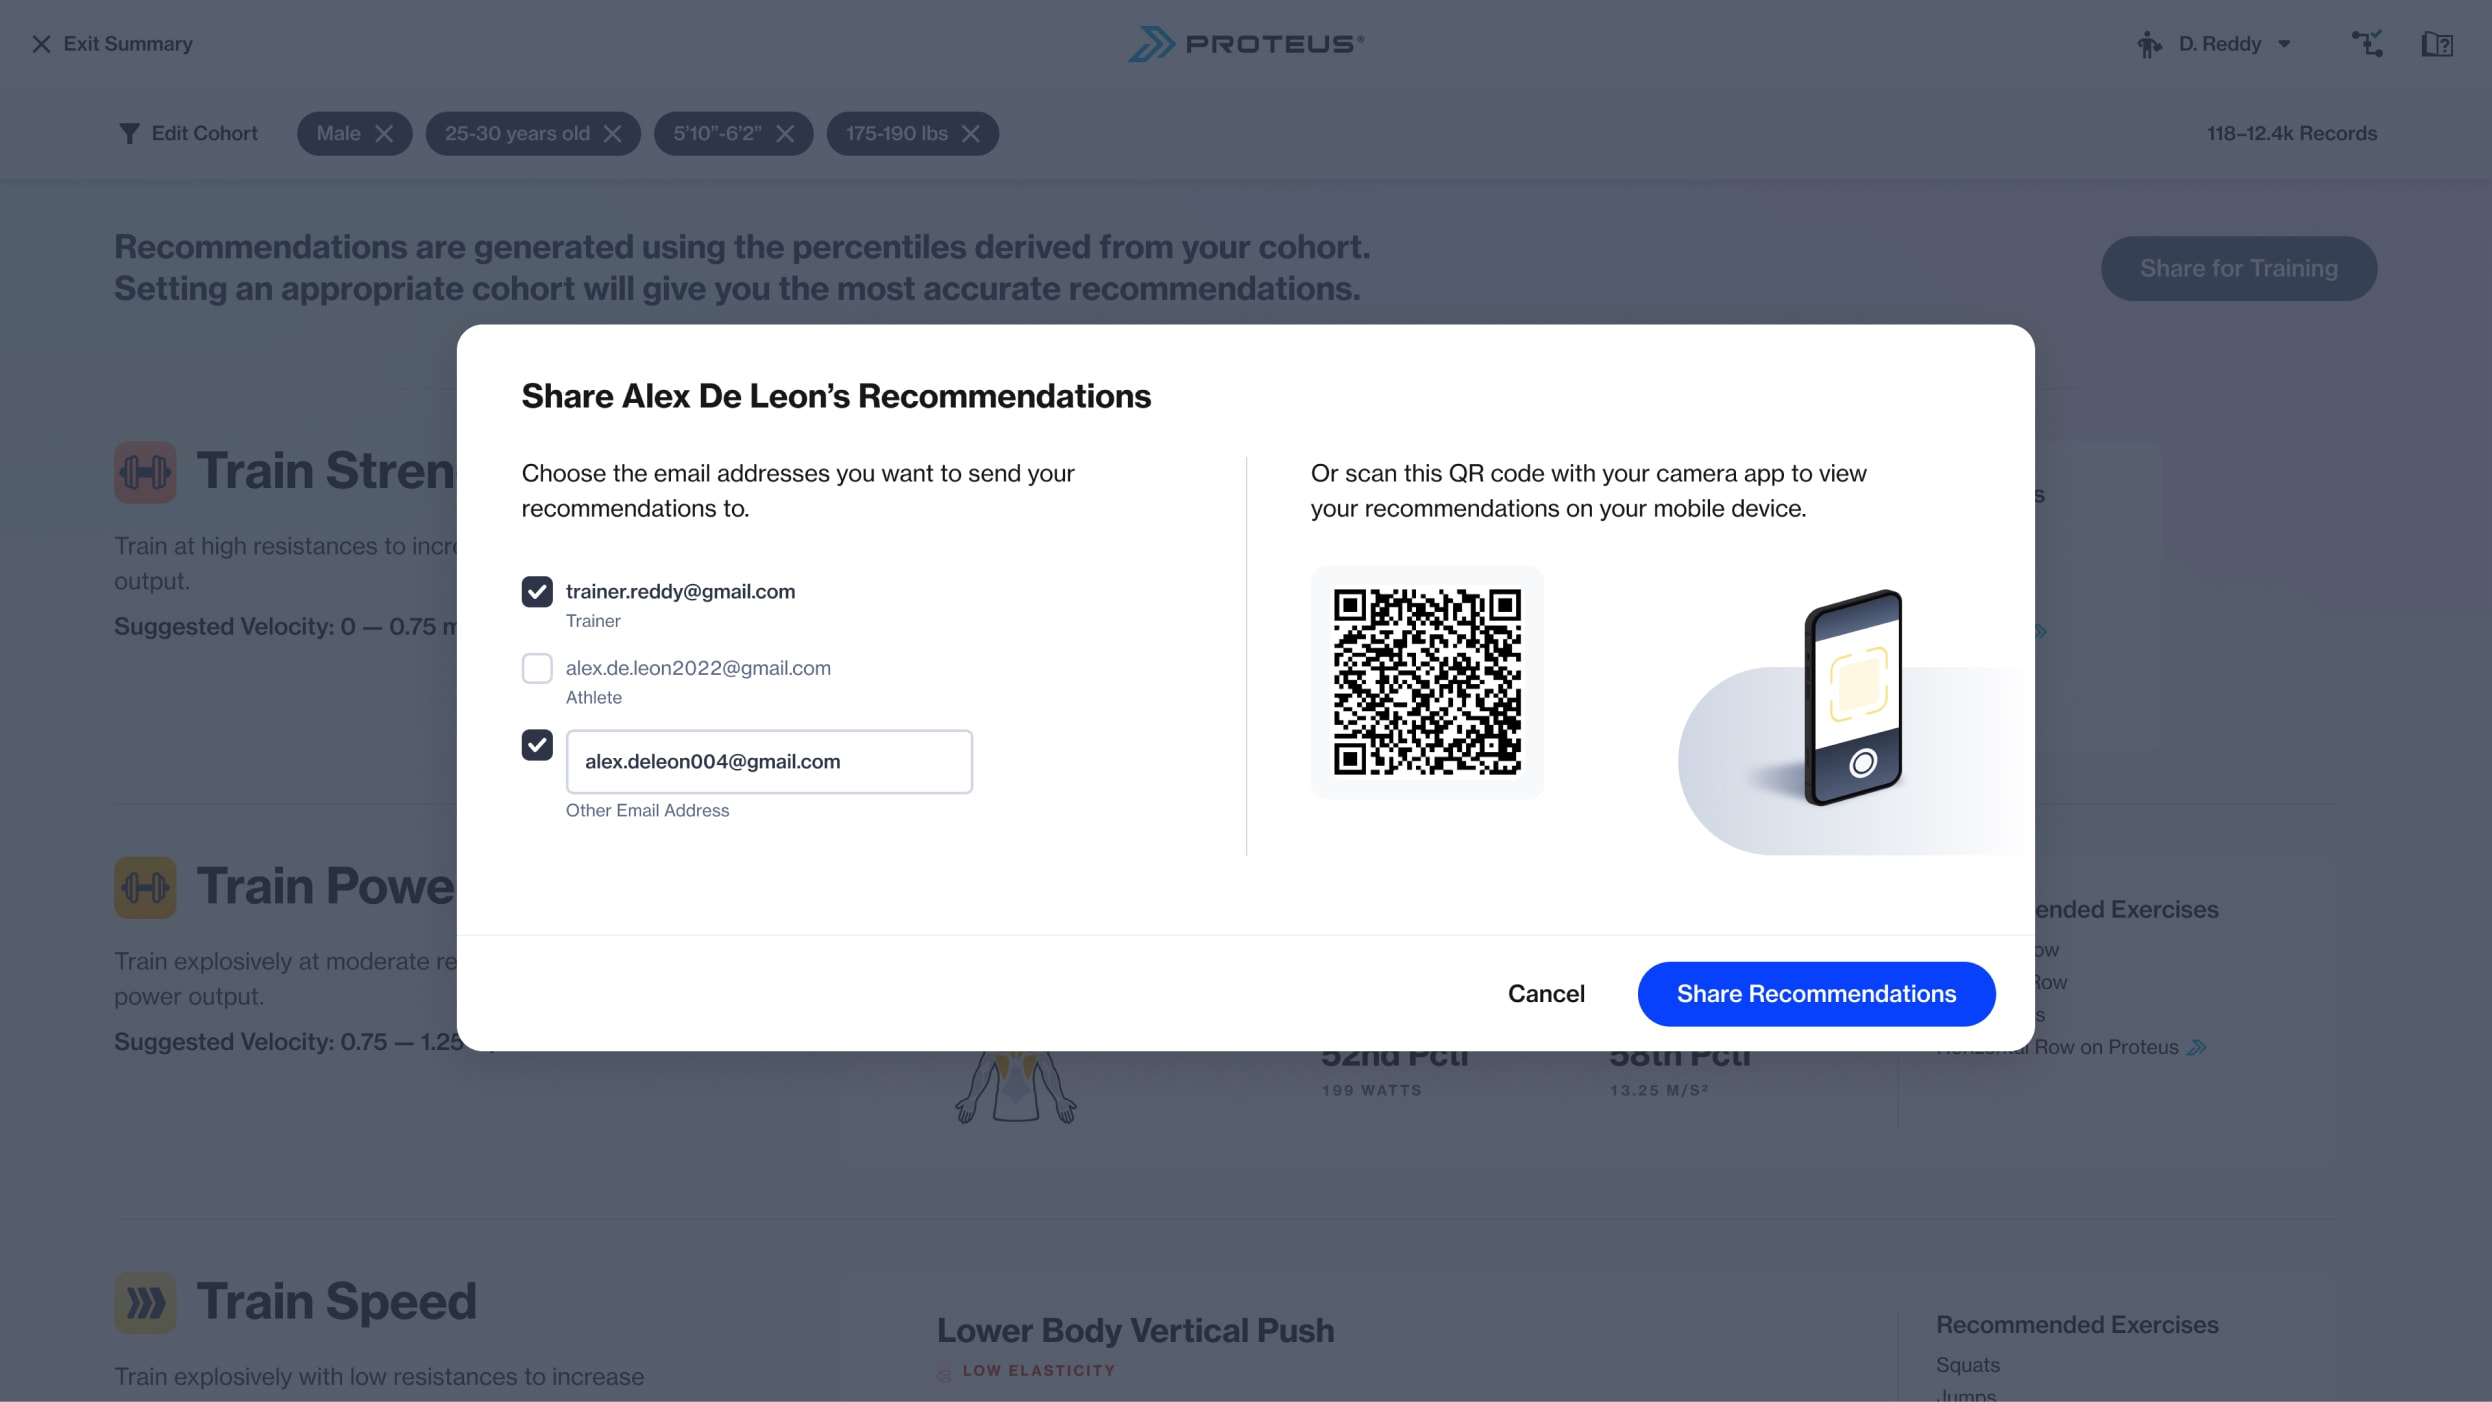
The "pocket guide" is often shared at the Proteus hardware after a test. In sports performance gym settings where athletes and trainers may not carry smartphones while training, sending recommendations to the athlete's email is most convenient. Alternatively, athletes can scan the on-screen QR code for immediate access.
The “Pocket Guide” for Training on the Go
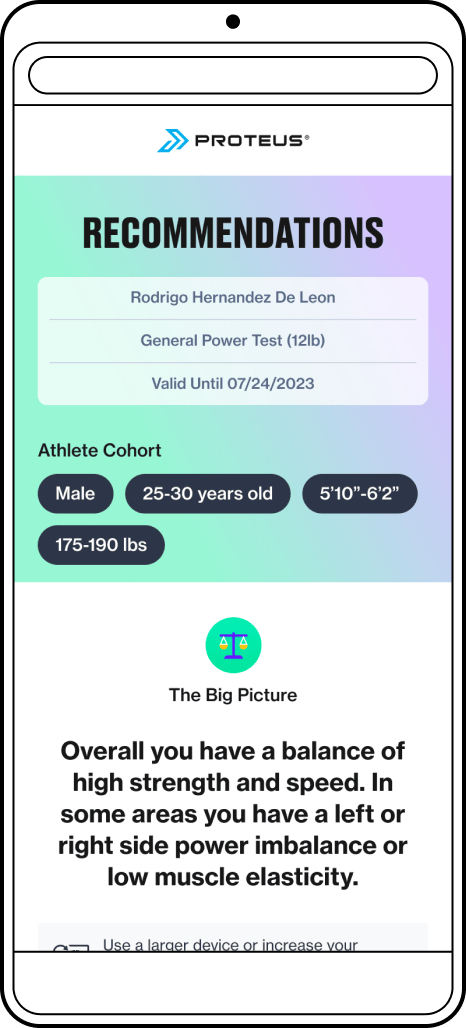
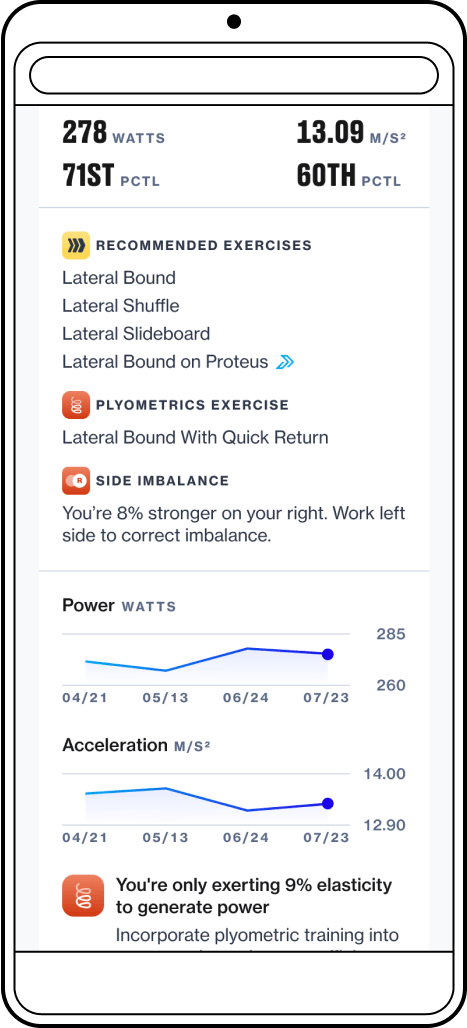
Initially, I intended for the "pocket guide" to be a simple display of prescribed training adaptations and exercises based on the athlete's test results—just the instructions and little else. However, it evolved over time into a miniature version of the reporting experience, including progress charts and performance metrics from the reference test. Although this extra information added little utility for an athlete's training, it served to remind athletes of their trainer's value proposition by showcasing progress to the athlete and their sponsors.
Impact and customer reception
The quarter after releasing the "pocket guide," we saw a notable increase in the average number of test sessions per customer site. Additionally, our bi-annual trainer survey indicated a rise in trainers reporting testing as their most used mode.
20%
Increase in testing at sites that were frequent testers
24%
Increase in testing across all sites
10%
Increase in trainers who reported Performance Testing as their most frequently used mode
According to the survey, the top reasons cited for frequently using our testing mode included “tracking progress”, “informing programming”, and “data and metrics”. This implied they found value in our new reporting approach.
Some anecdotal post-launch feedback from customers:
“We started selling Proteus performance tests to athletes and in just two back-to-back Saturdays we generated $3,750 of new revenue!”
“The new software gives my trainers superpowers — in minutes they can identify specific areas needing attention and work that into a personalized program.”
“Having worked most of my entire career in golf evaluation programs, I can absolutely say that this is the first time there is actual quantifiable analysis available to help you with your golf game. No opinion. No guesses. Just analysis and results! Game changer! THX Proteus!”
“Most people get performance testing once a month, I make my own programming for clients based on what proteus says they should work on.”
This work not only impacted customer engagement metrics but also benefited our software engineering team. By consolidating data into fewer views and creating an extensible platform, we significantly reduced future engineering effort for creating and maintaining Power Reports.
4
Legacy views deprecated
0
Hours spent working on Power Reports in 2023
Nil
Amount of engineering effort required to enable functionality for new tests
Related Work
Group Performance Testing
Adding multiplayer capabilities to our powerful testing mode.
Proteus Software Experience
A collection of software features designed for a one-of-a-kind hardware product.
© 2024 Will Gabrenya