Our small but mighty software team consistently punched above it’s weight, quickly releasing critical features while navigating unique technology and usage constraints inherent in our athletic training and physical assessment product.
As a product owner and designer, I directly shaped much of the software experience, bringing crucial functionality to our customers while impacting our key performance metrics and reducing hardware production and servicing costs.
Organization
Proteus Motion
My Role
Principal Designer
The Team (varies by project)
Steven Bazarian, Andres Gonzalez, Brendan Kelly, Justin Maskell, Doug Moore, Jason Shaev, Jaskar Singh, Will Waterman
Introducing right-sized processes
As Proteus Motion scaled in size and aspiration, I recognized the need for a more deliberate approach to software development and planning. Jason Shaev, the director of software engineering and I had backgrounds working at more mature organizations, and we were uncomfortable with the company’s current rudderless approach to building our software product.
What should we build?
Historically, features were dictated by individual customer requests. The louder or more influential the customer, the more likely they would get what they desired. In order to create stability for the software team, Jason and I introduced roadmap planning to Proteus Motion. We challenged our CEO to define company goals and desired outcomes to help narrow down an ever-growing wishlist of feature ideas and requests. A scattershot approach likely wouldn’t move the needle meaningfully for sales, but a thought through development plan would be necessary for the next round of fundraising. We prioritized according to criteria such as business value, complexity, dependencies, time to impact, and more. Even though we weren’t always able to stick with our roadmap, eventually our efforts inspired future outcomes-oriented strategic planning throughout the company.
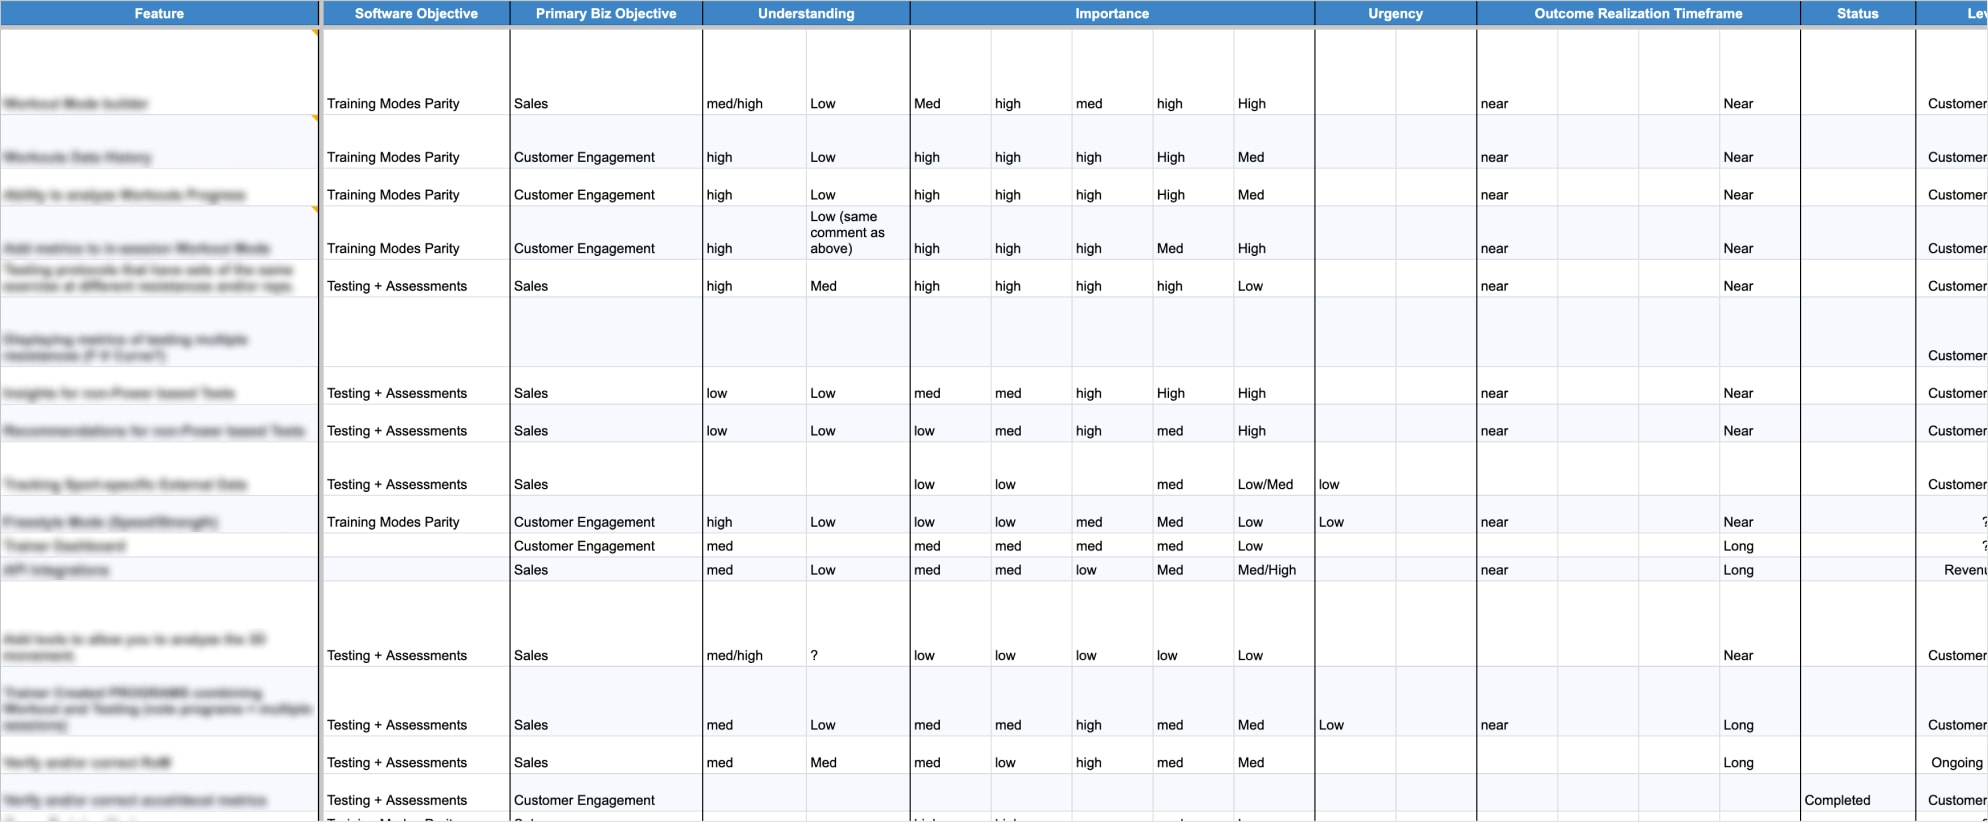
Graded list of (obscured) project ideas (70+ and increasing)
How do we build it?
As most of our leadership team had no prior software development experience, we recognized that we needed to educate them on what an ideal feature development process might look like. With no product or project managers, if was up to Jason and I to determine how much process was appropriate at the Proteus Motion’s current scale. A robust approach used at a large organization wouldn’t make sense at a small startup where speed was more important than perfection. I mapped out a simplified product development approach roughly inspired by the good ol’ double diamond design process. Organized according to a RACI framework with the expected output at each stage helped stakeholders understand their involvement throughout and what milestone artifacts would be produced. I presented this to the CEO suggesting that we could be flexible and remove steps as dictated by project complexity and time constraints to assuage fears that our process would slow down development.
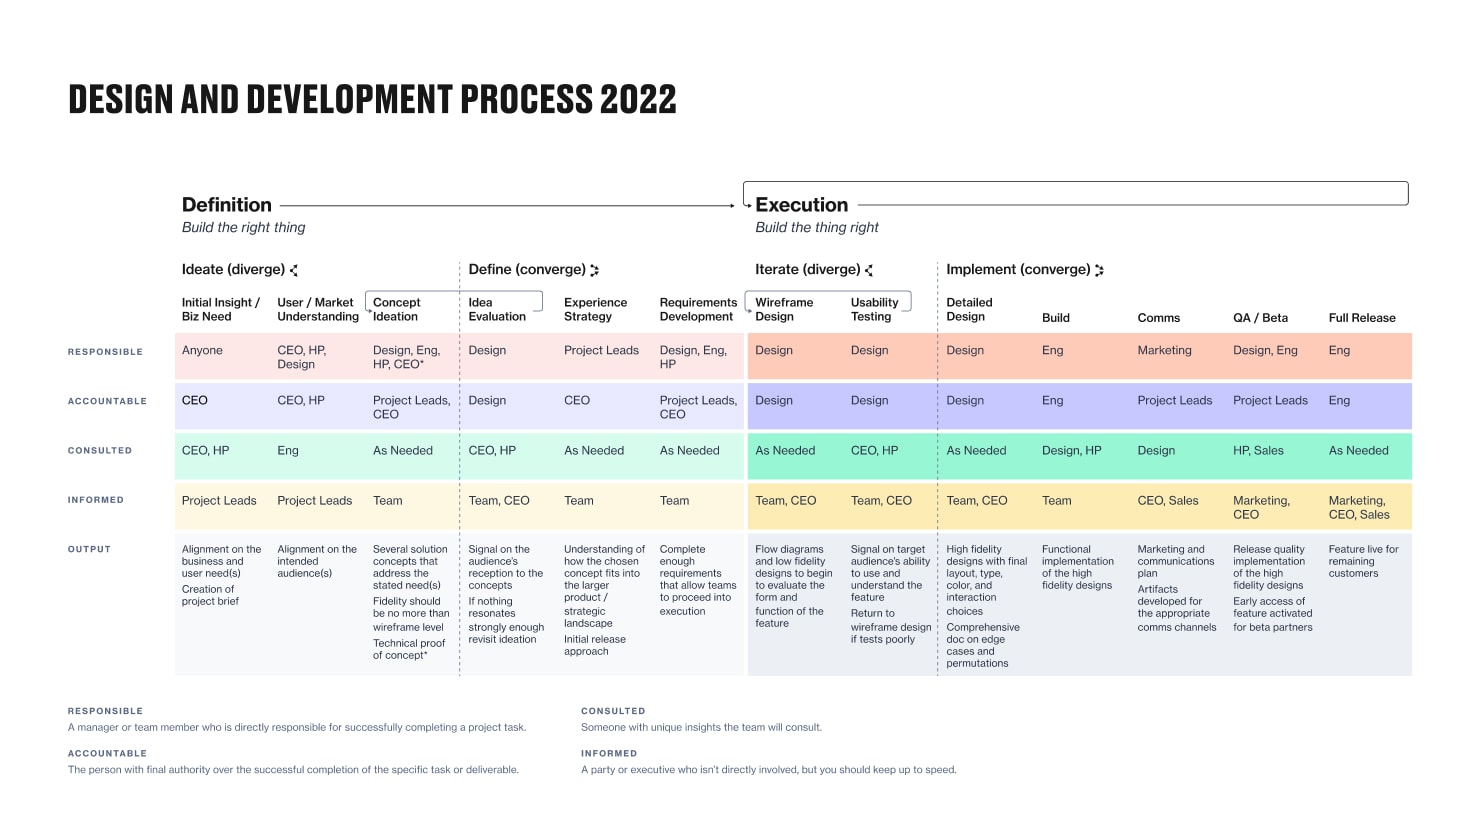
Proposed development process for large projects
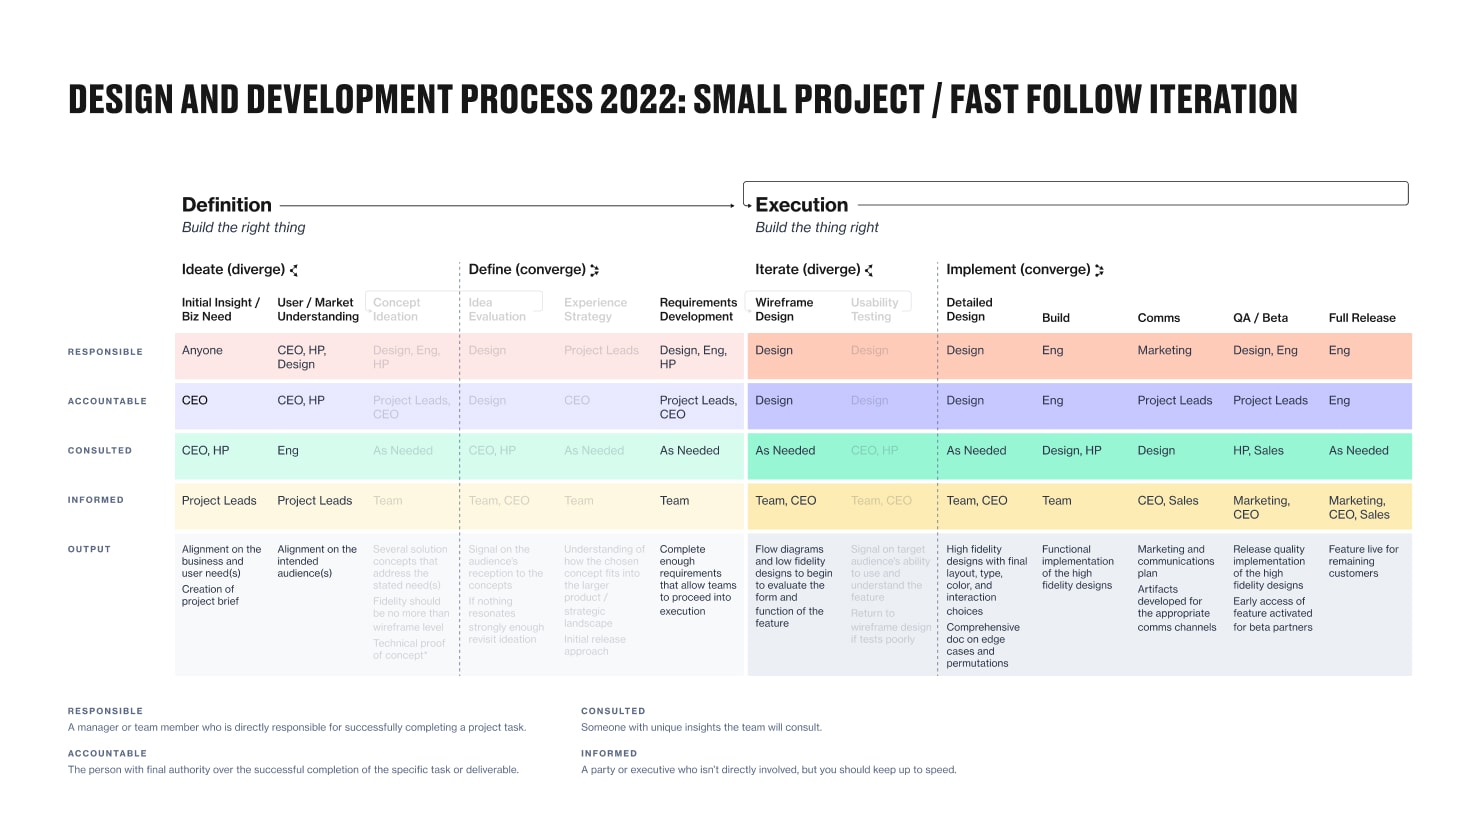
Scaled back process for small projects
Along with our proposed process, I continually advocated for an outcomes based approach to feature definition rather than starting with firm stakeholder requirements. Over time, we slowly eroded their requirements-first mindset allowing more openness to broader ideation, and a better likelihood of success.
Improving the active experience
Proteus offers three core activity modes for athletes to train and test on:
Freestyle: A "sandbox" mode with no set structure.
Workouts: A guided, time-based training mode with a playlist of exercises.
Performance Testing: Assessing an athlete’s ability to generate peak power and acceleration.
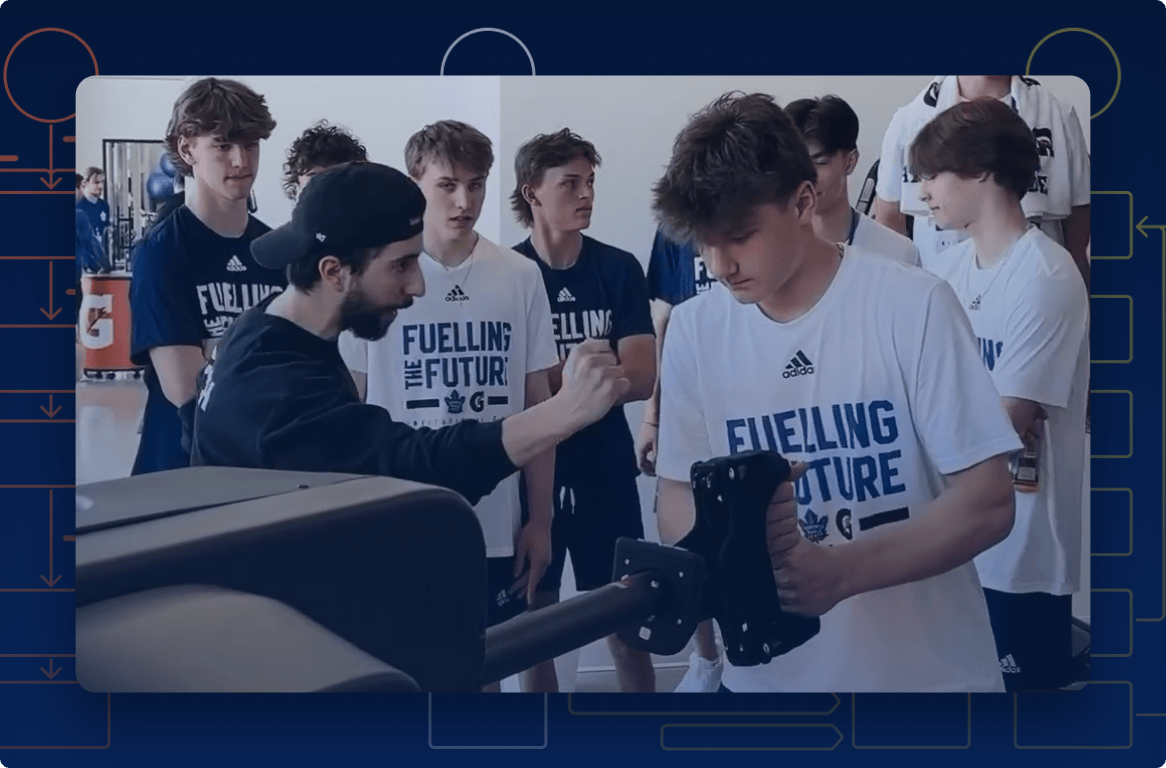
Our efforts over the past couple of years have been focused on improving the Performance Testing and Freestyle activity modes. Performance Testing is the most important mode on Proteus because it is central to our value proposition for the product and the only way we currently gather performance data. Testing is the best way to provide tangible proof of progress and to diagnose problem areas related to an athlete’s physical condition. Freestyle is our easiest mode for training—essentially our version of “quick start” on a treadmill. It is the mode that garners the most regular usage in our product, and most frequently showcased across our customer’s social media.
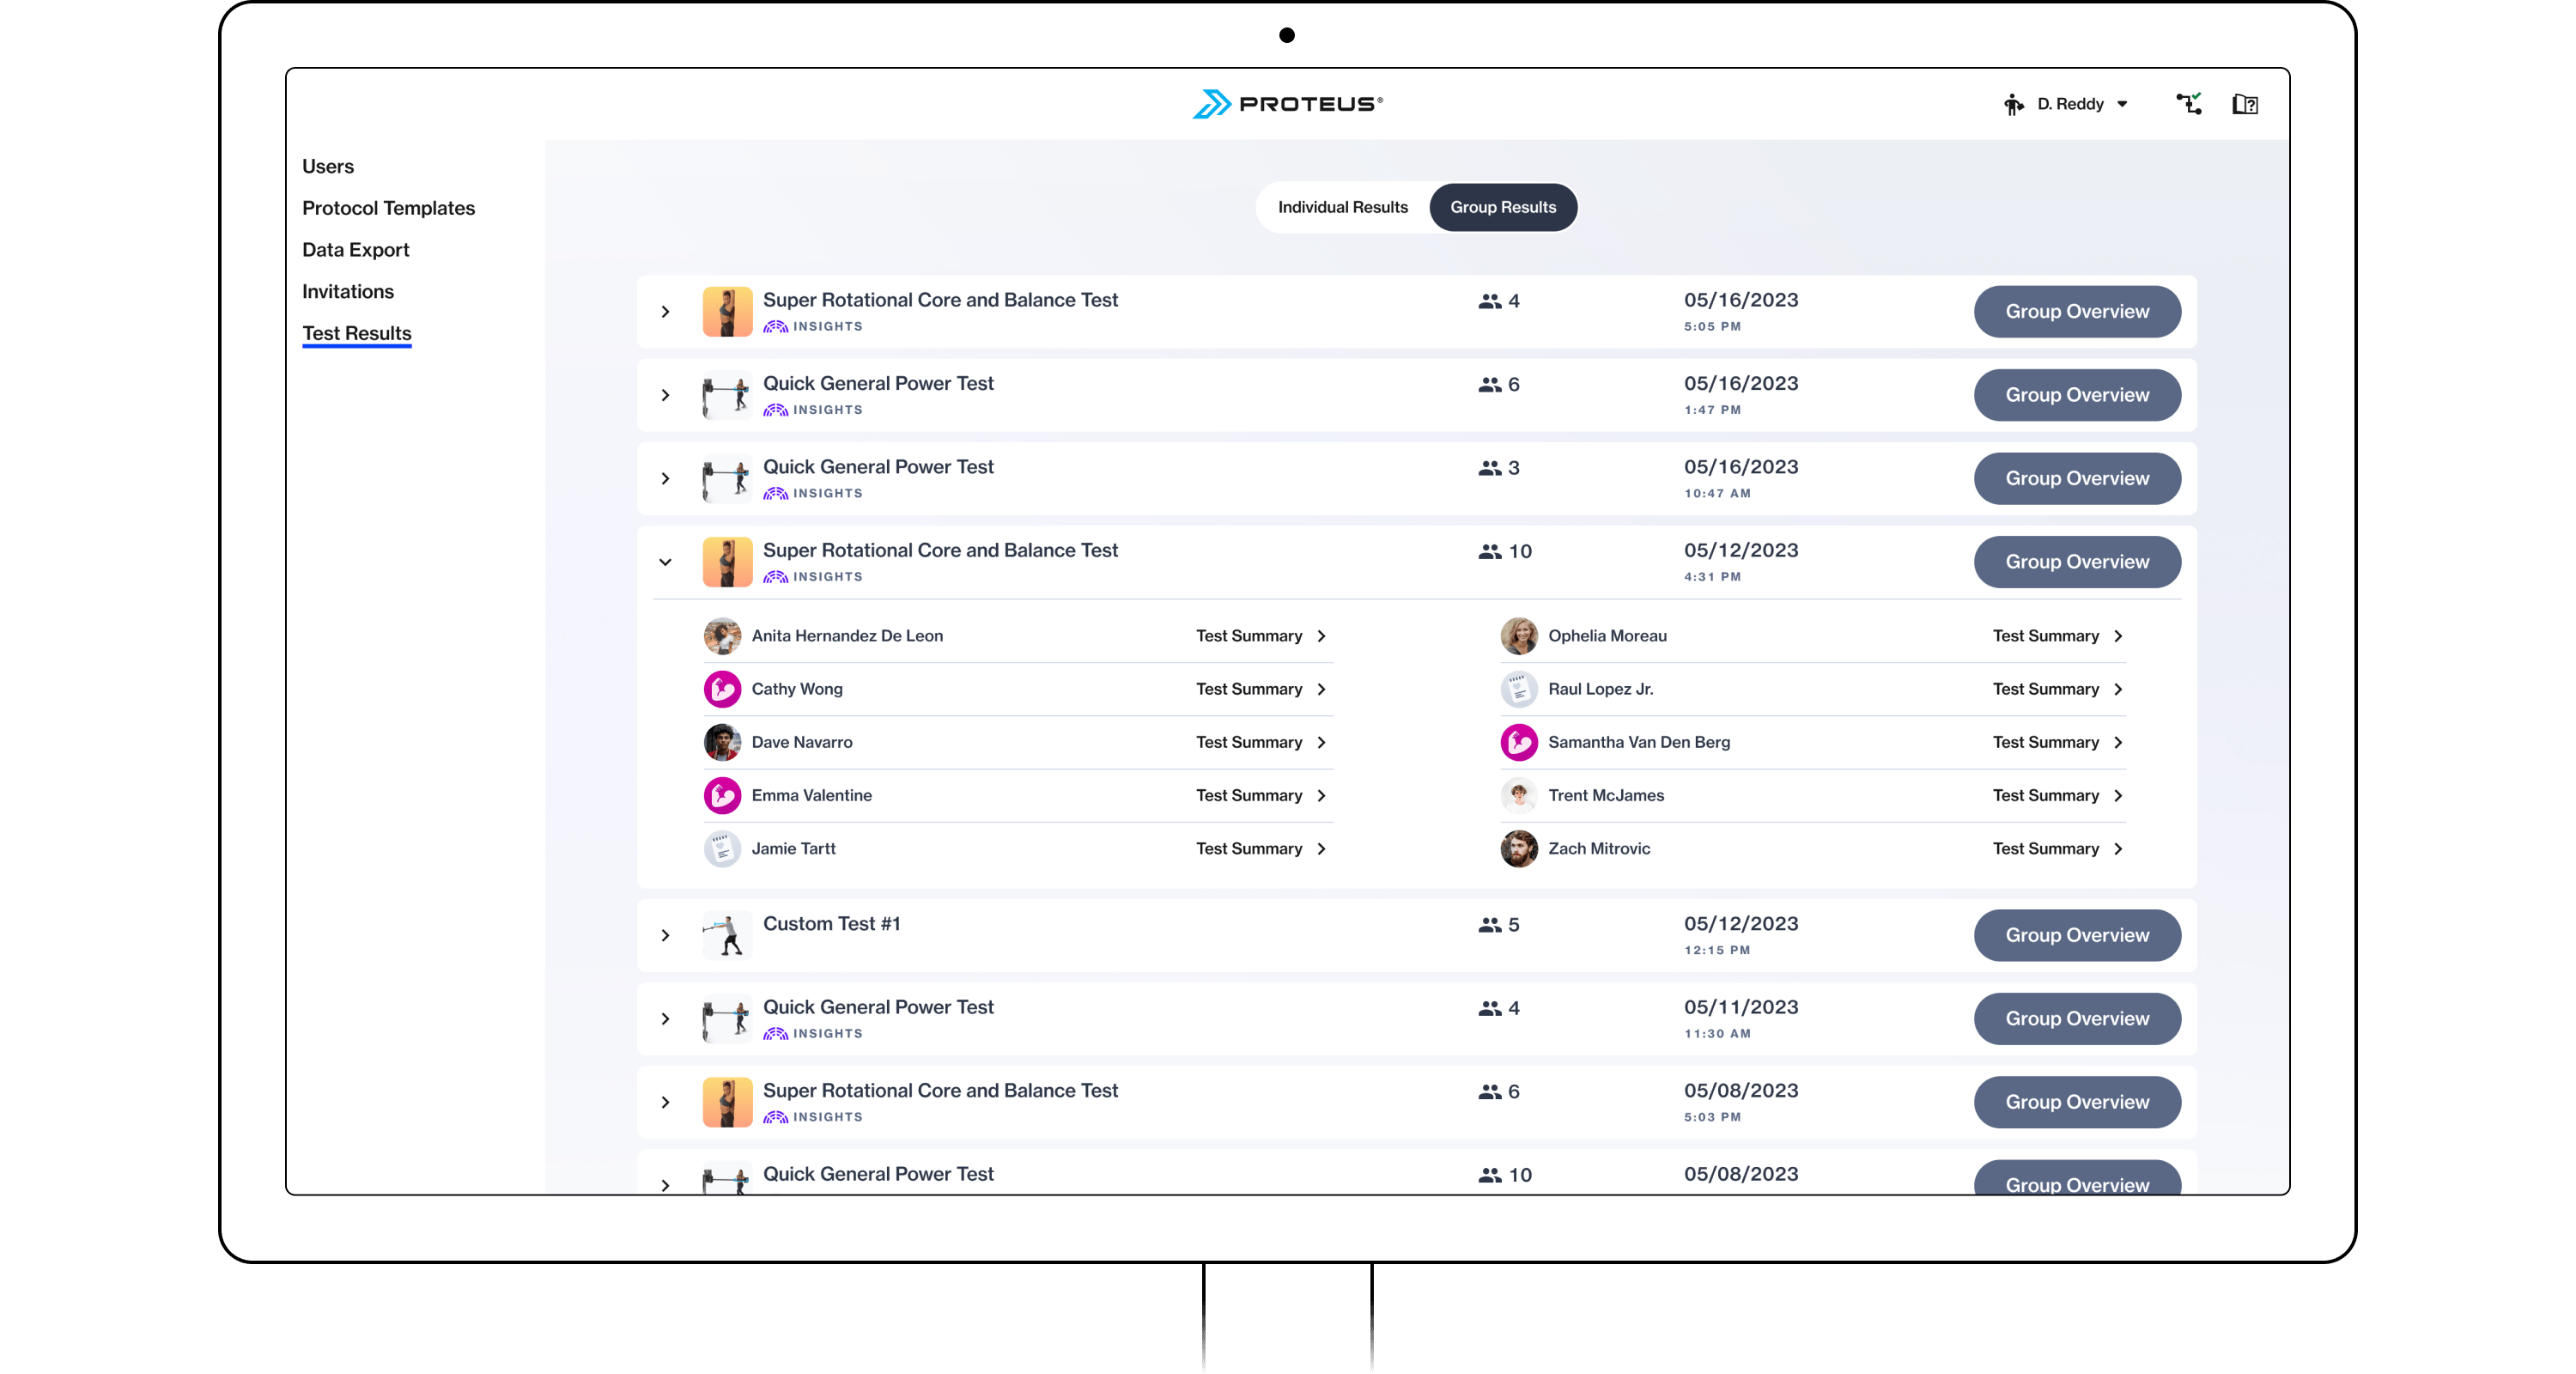
Group Performance Testing
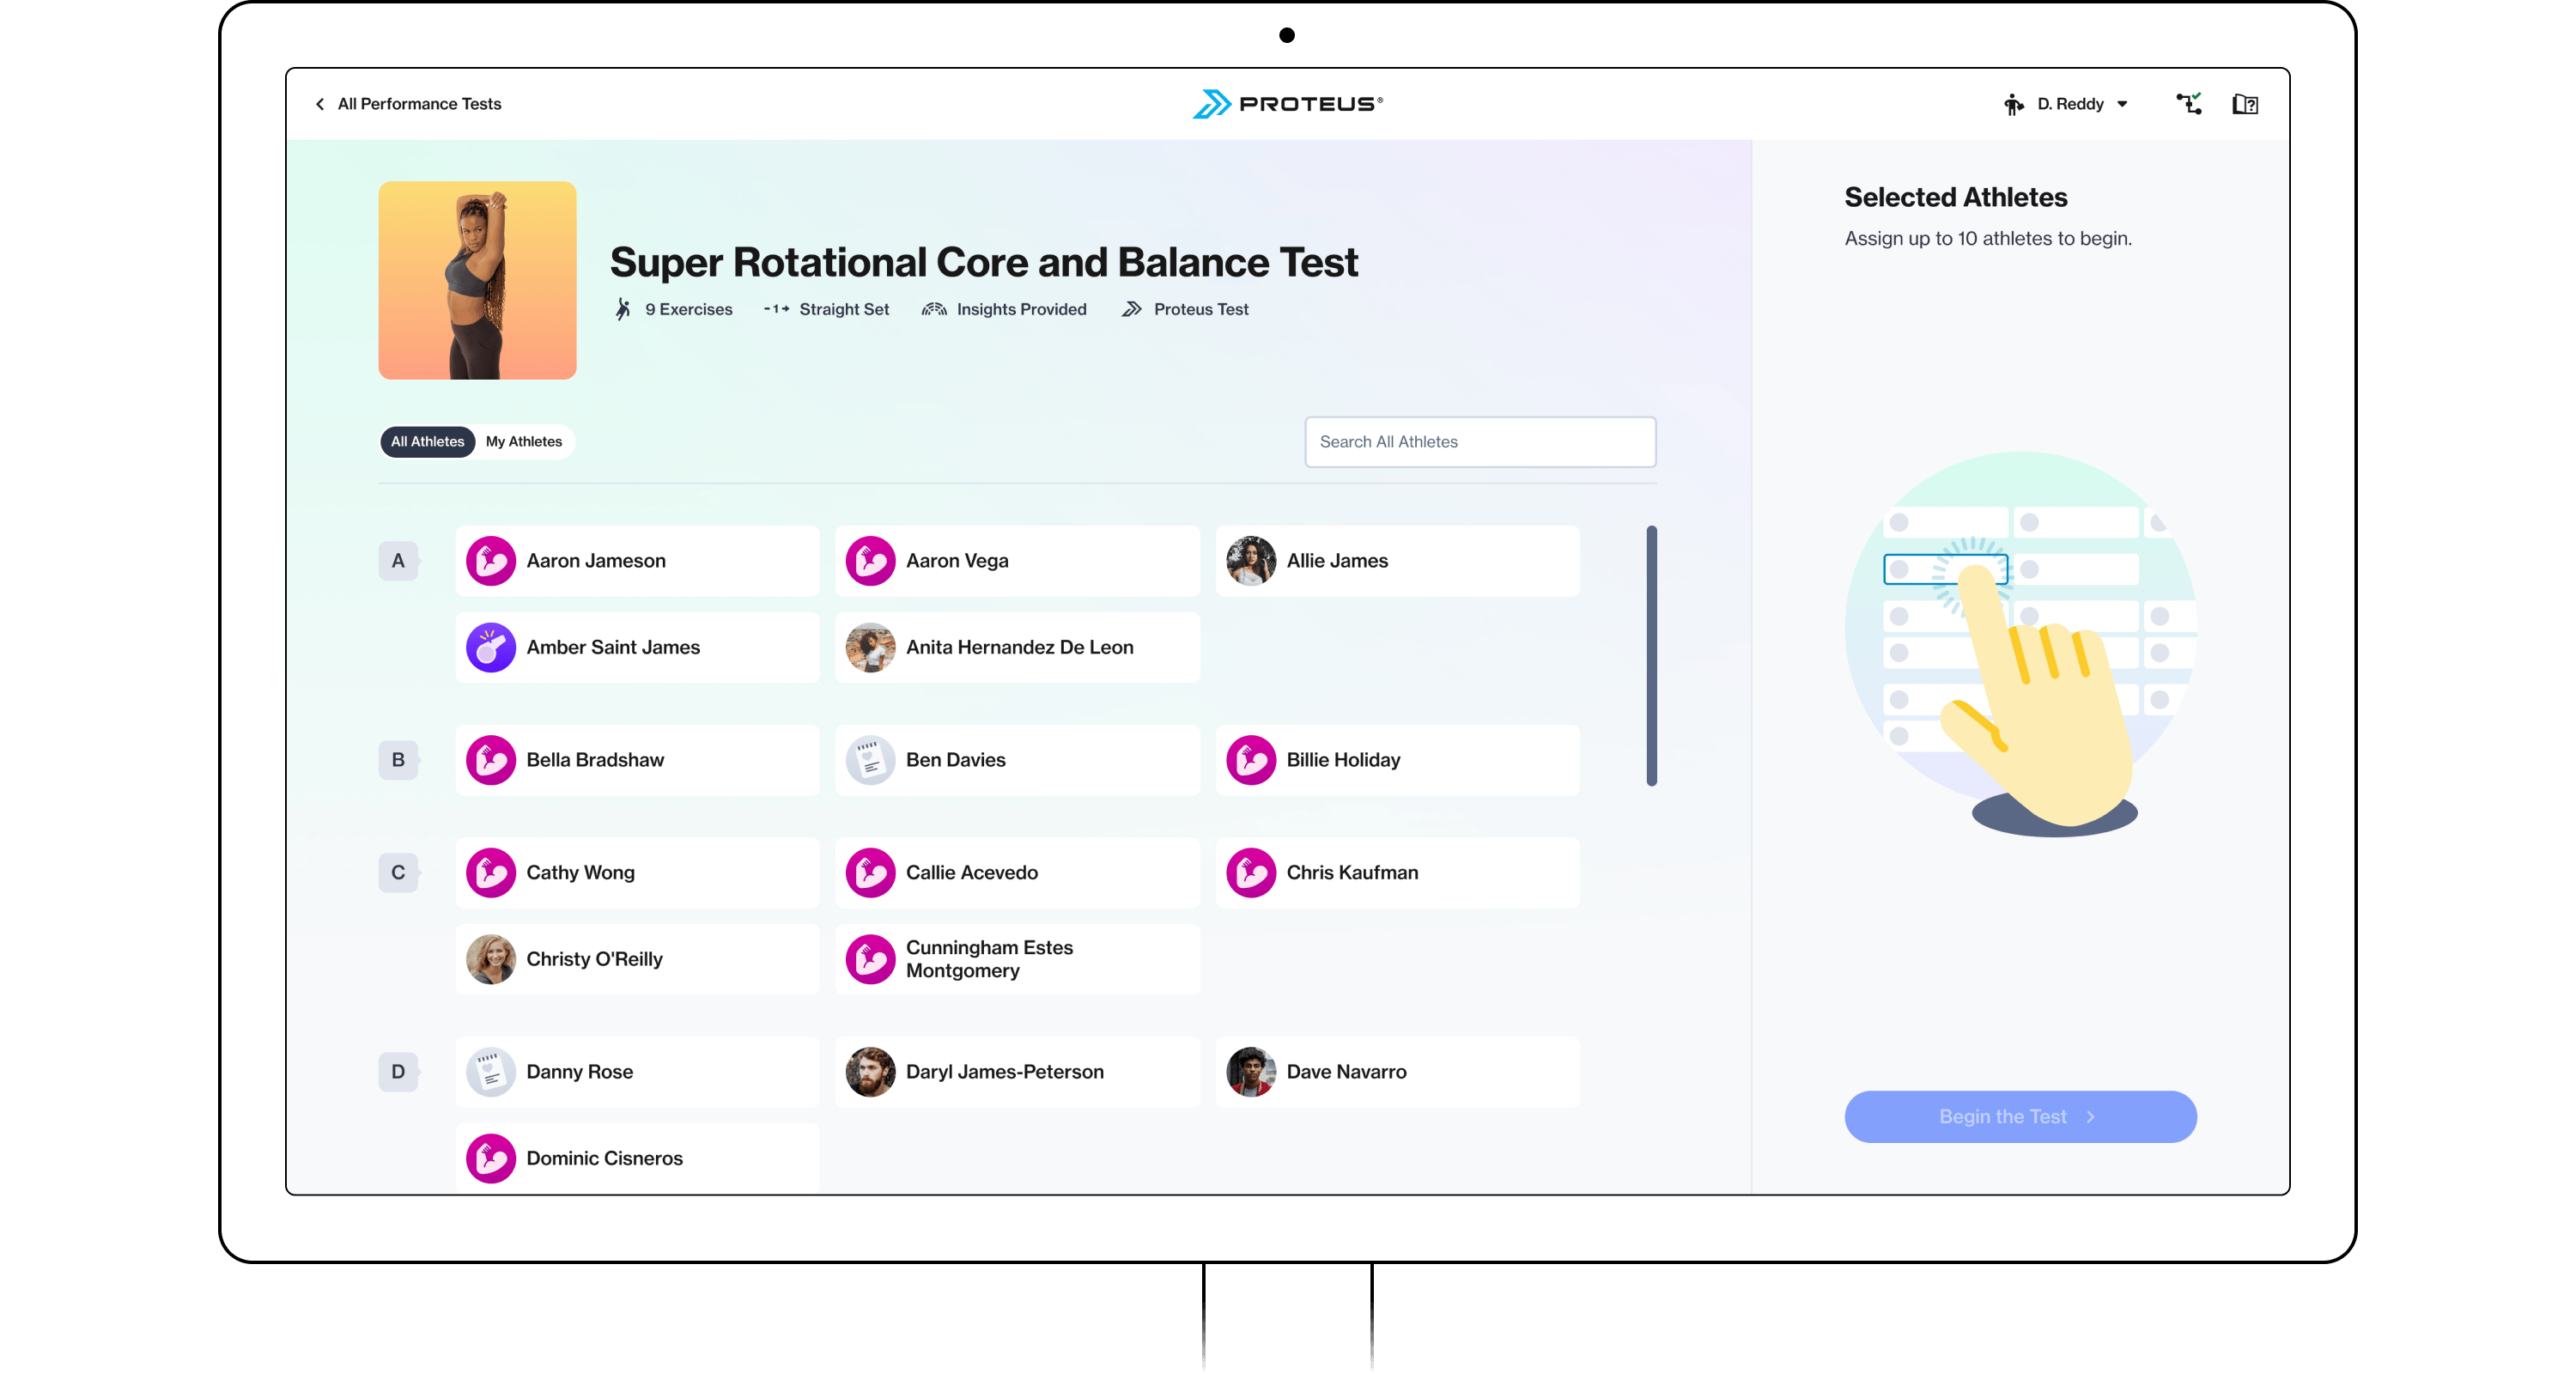
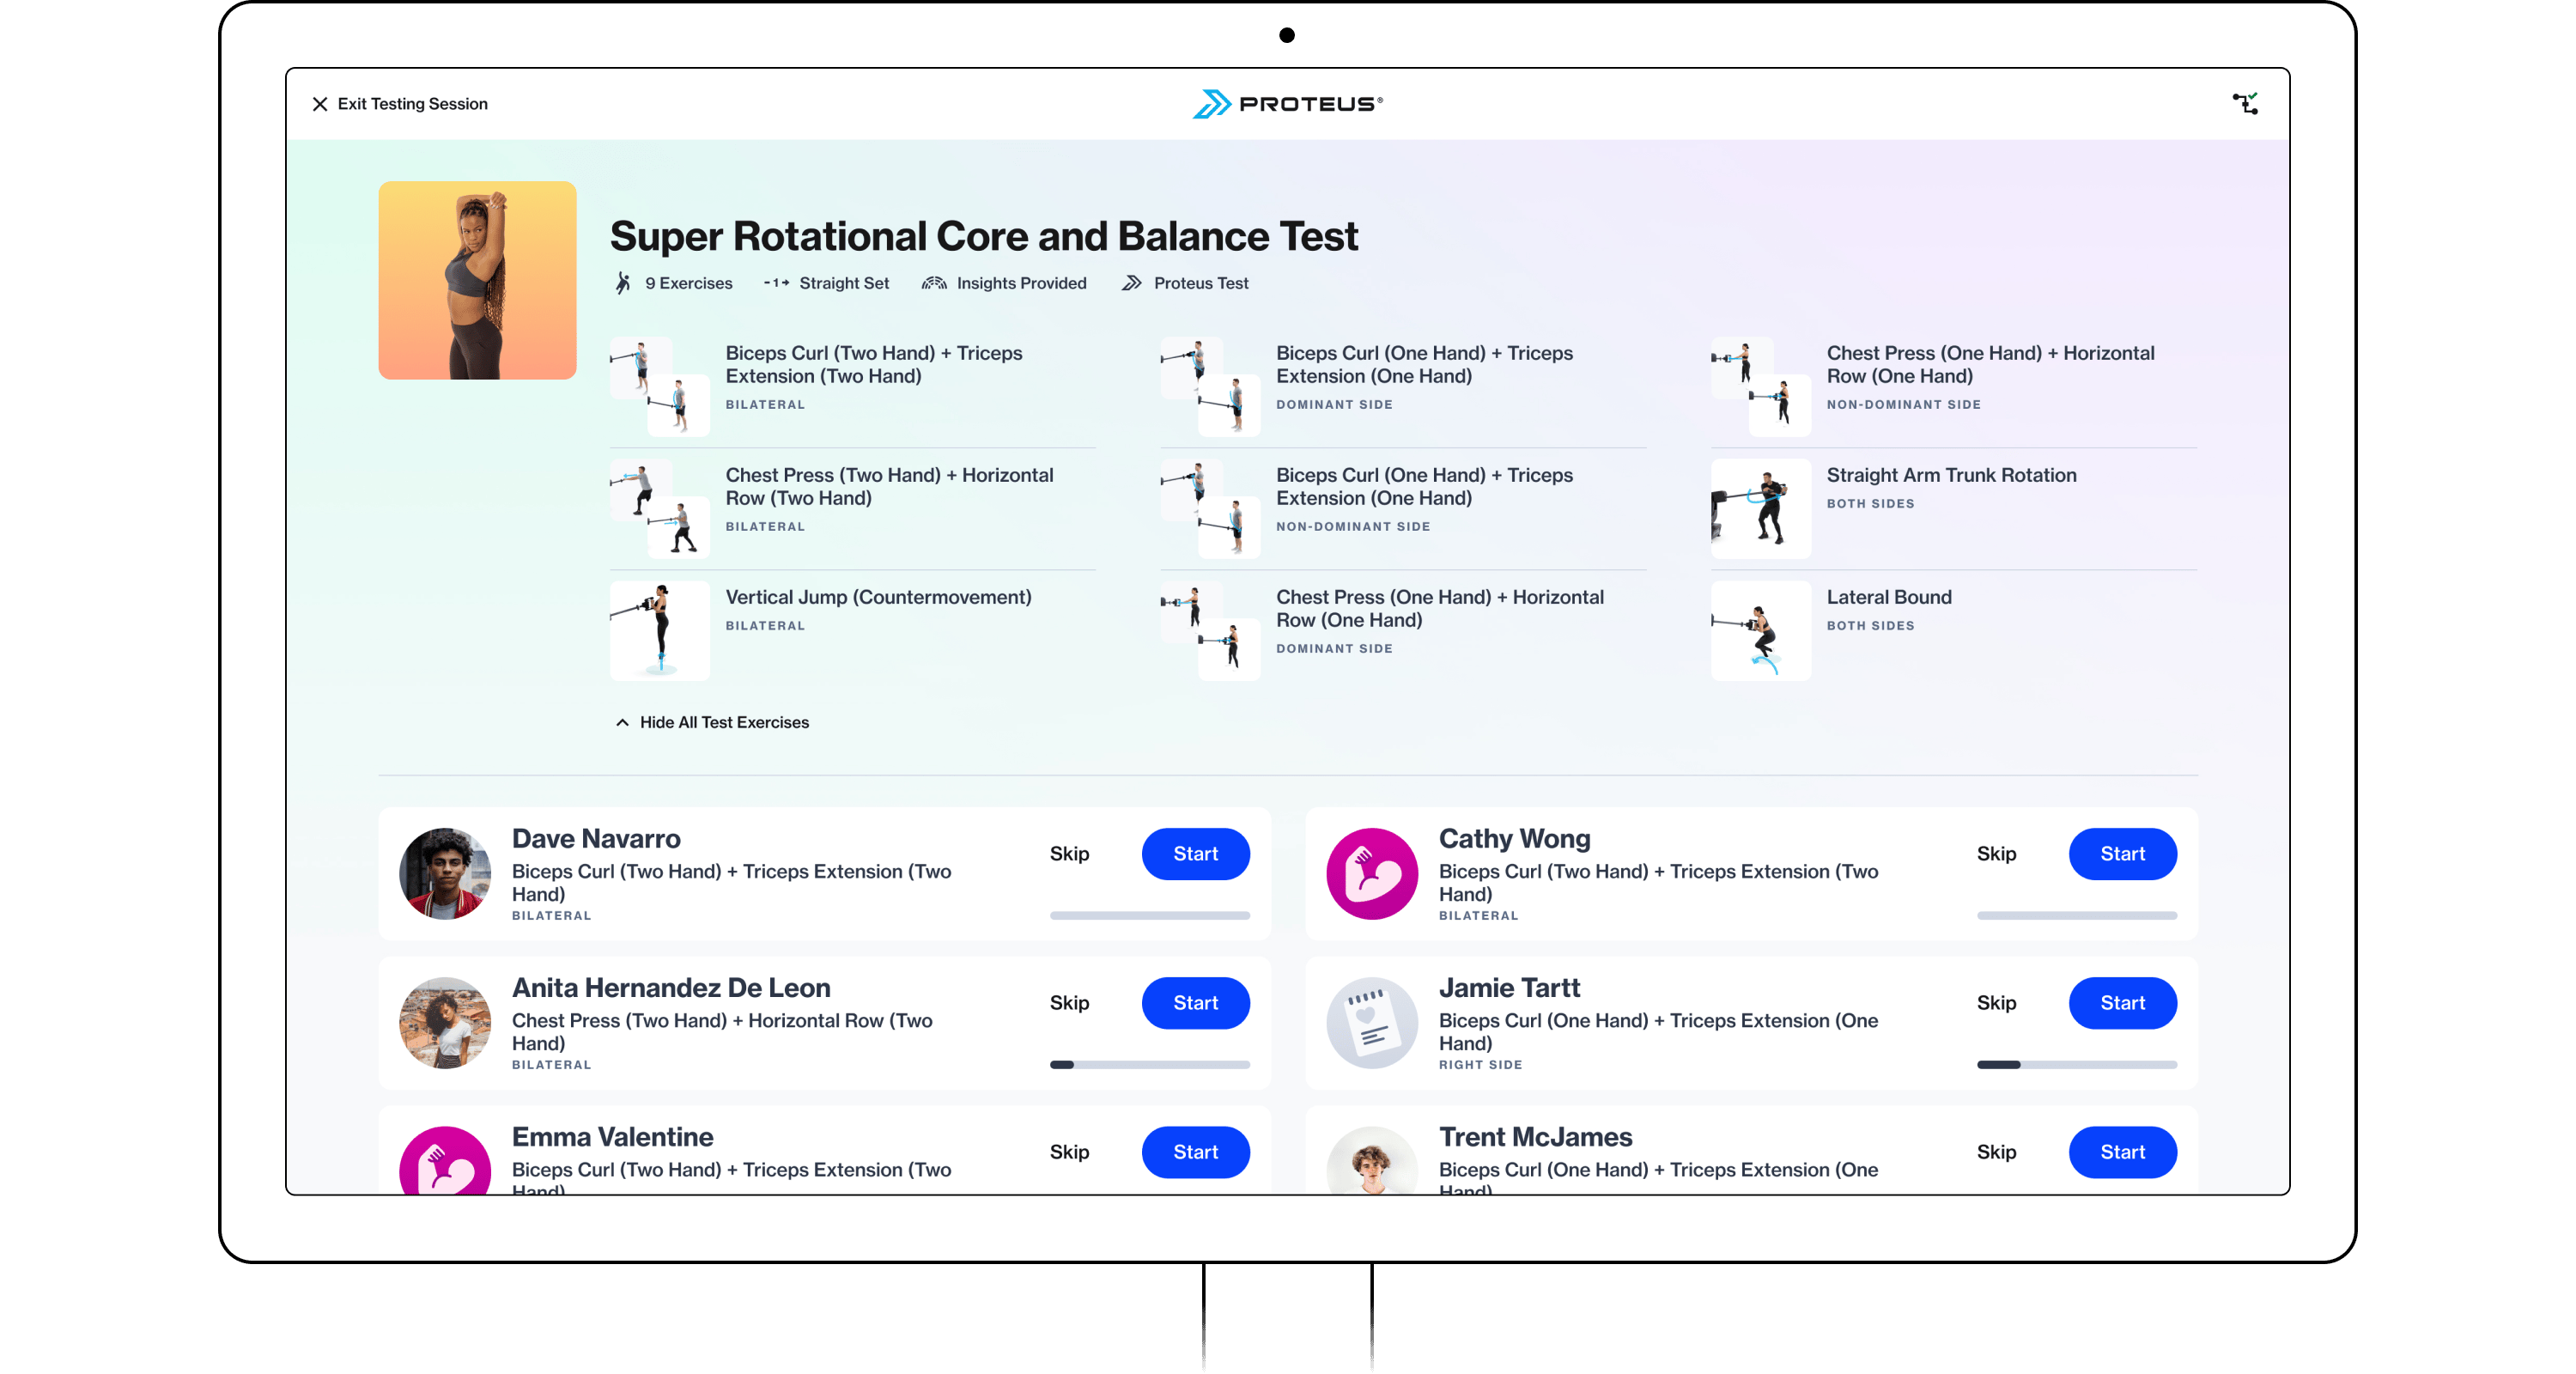
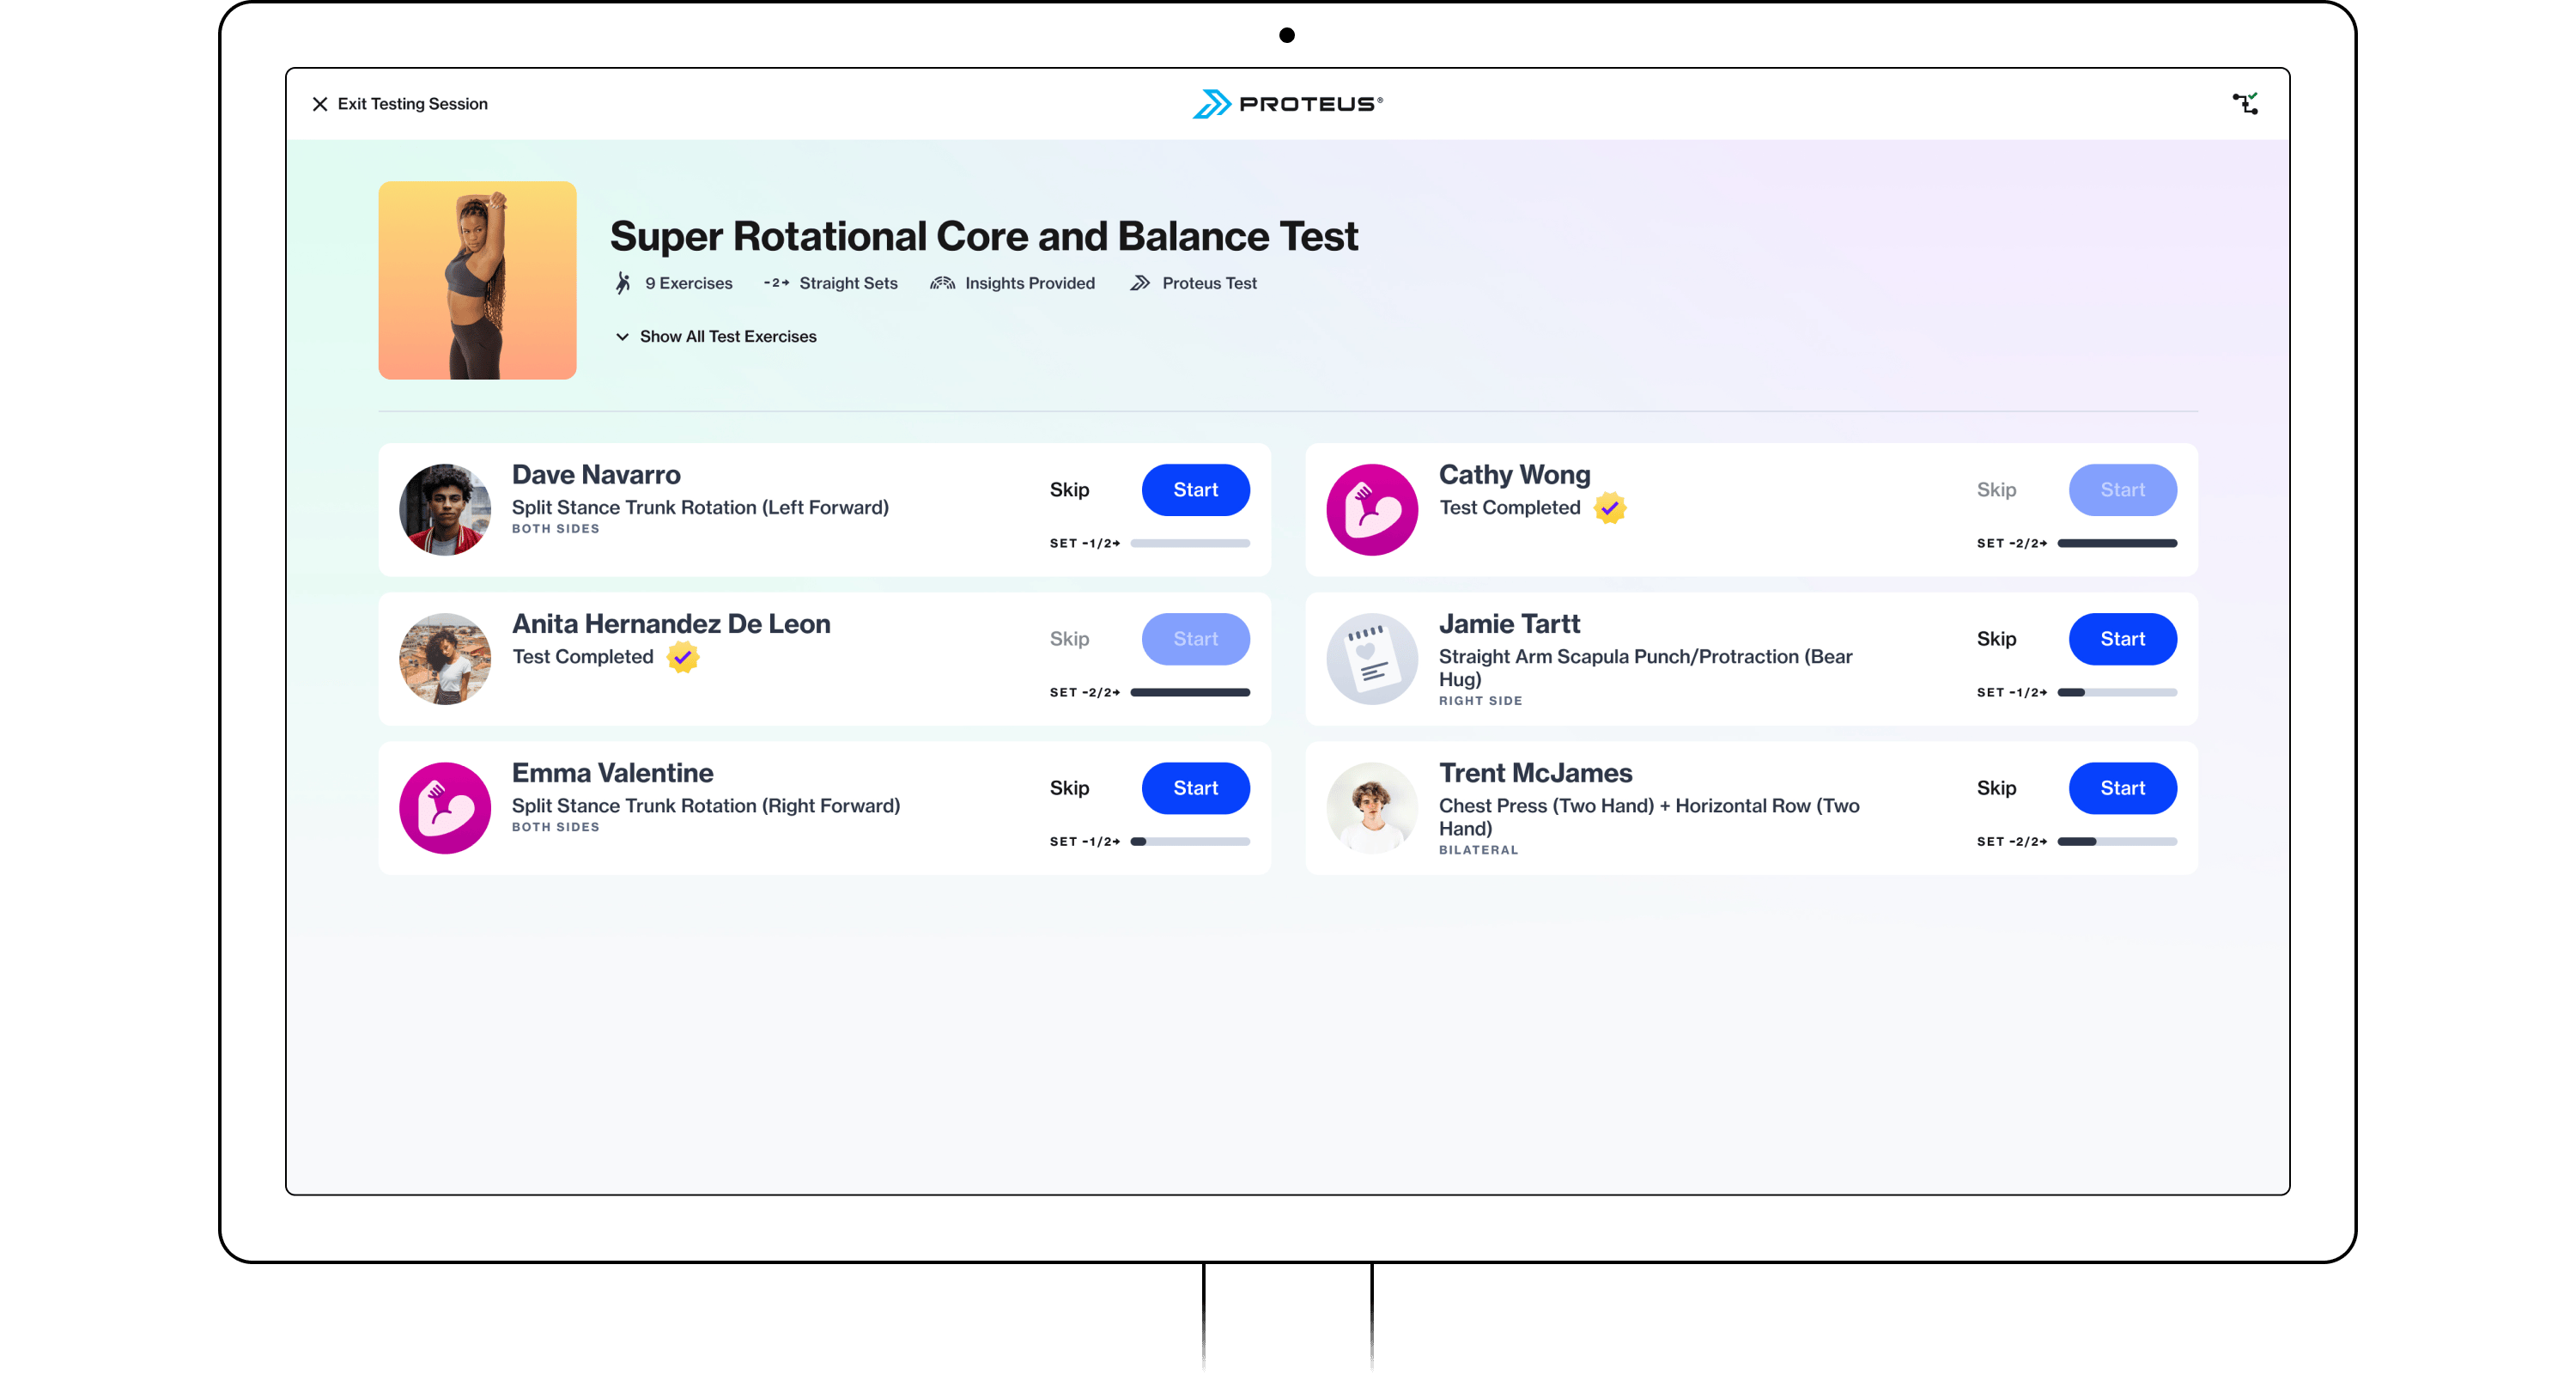
One of the most impactful updates to Proteus was the introduction of group testing. Previously, performance testing was conducted with one athlete at a time. This was limiting for customers training multiple athletes at once or running team testing events. Group testing aimed to increase the efficiency of testing at scale in order to improve ROI for our customers and create more opportunities for us to collect performance data.
This required significant changes to our software architecture, affecting activity setup, administrative functions, and the initial authenticated home view. To adapt our testing mode for groups, I designed functionality for initiating a multi-user session, progressing through the test flow, summing group results, and providing access to detailed reporting data.
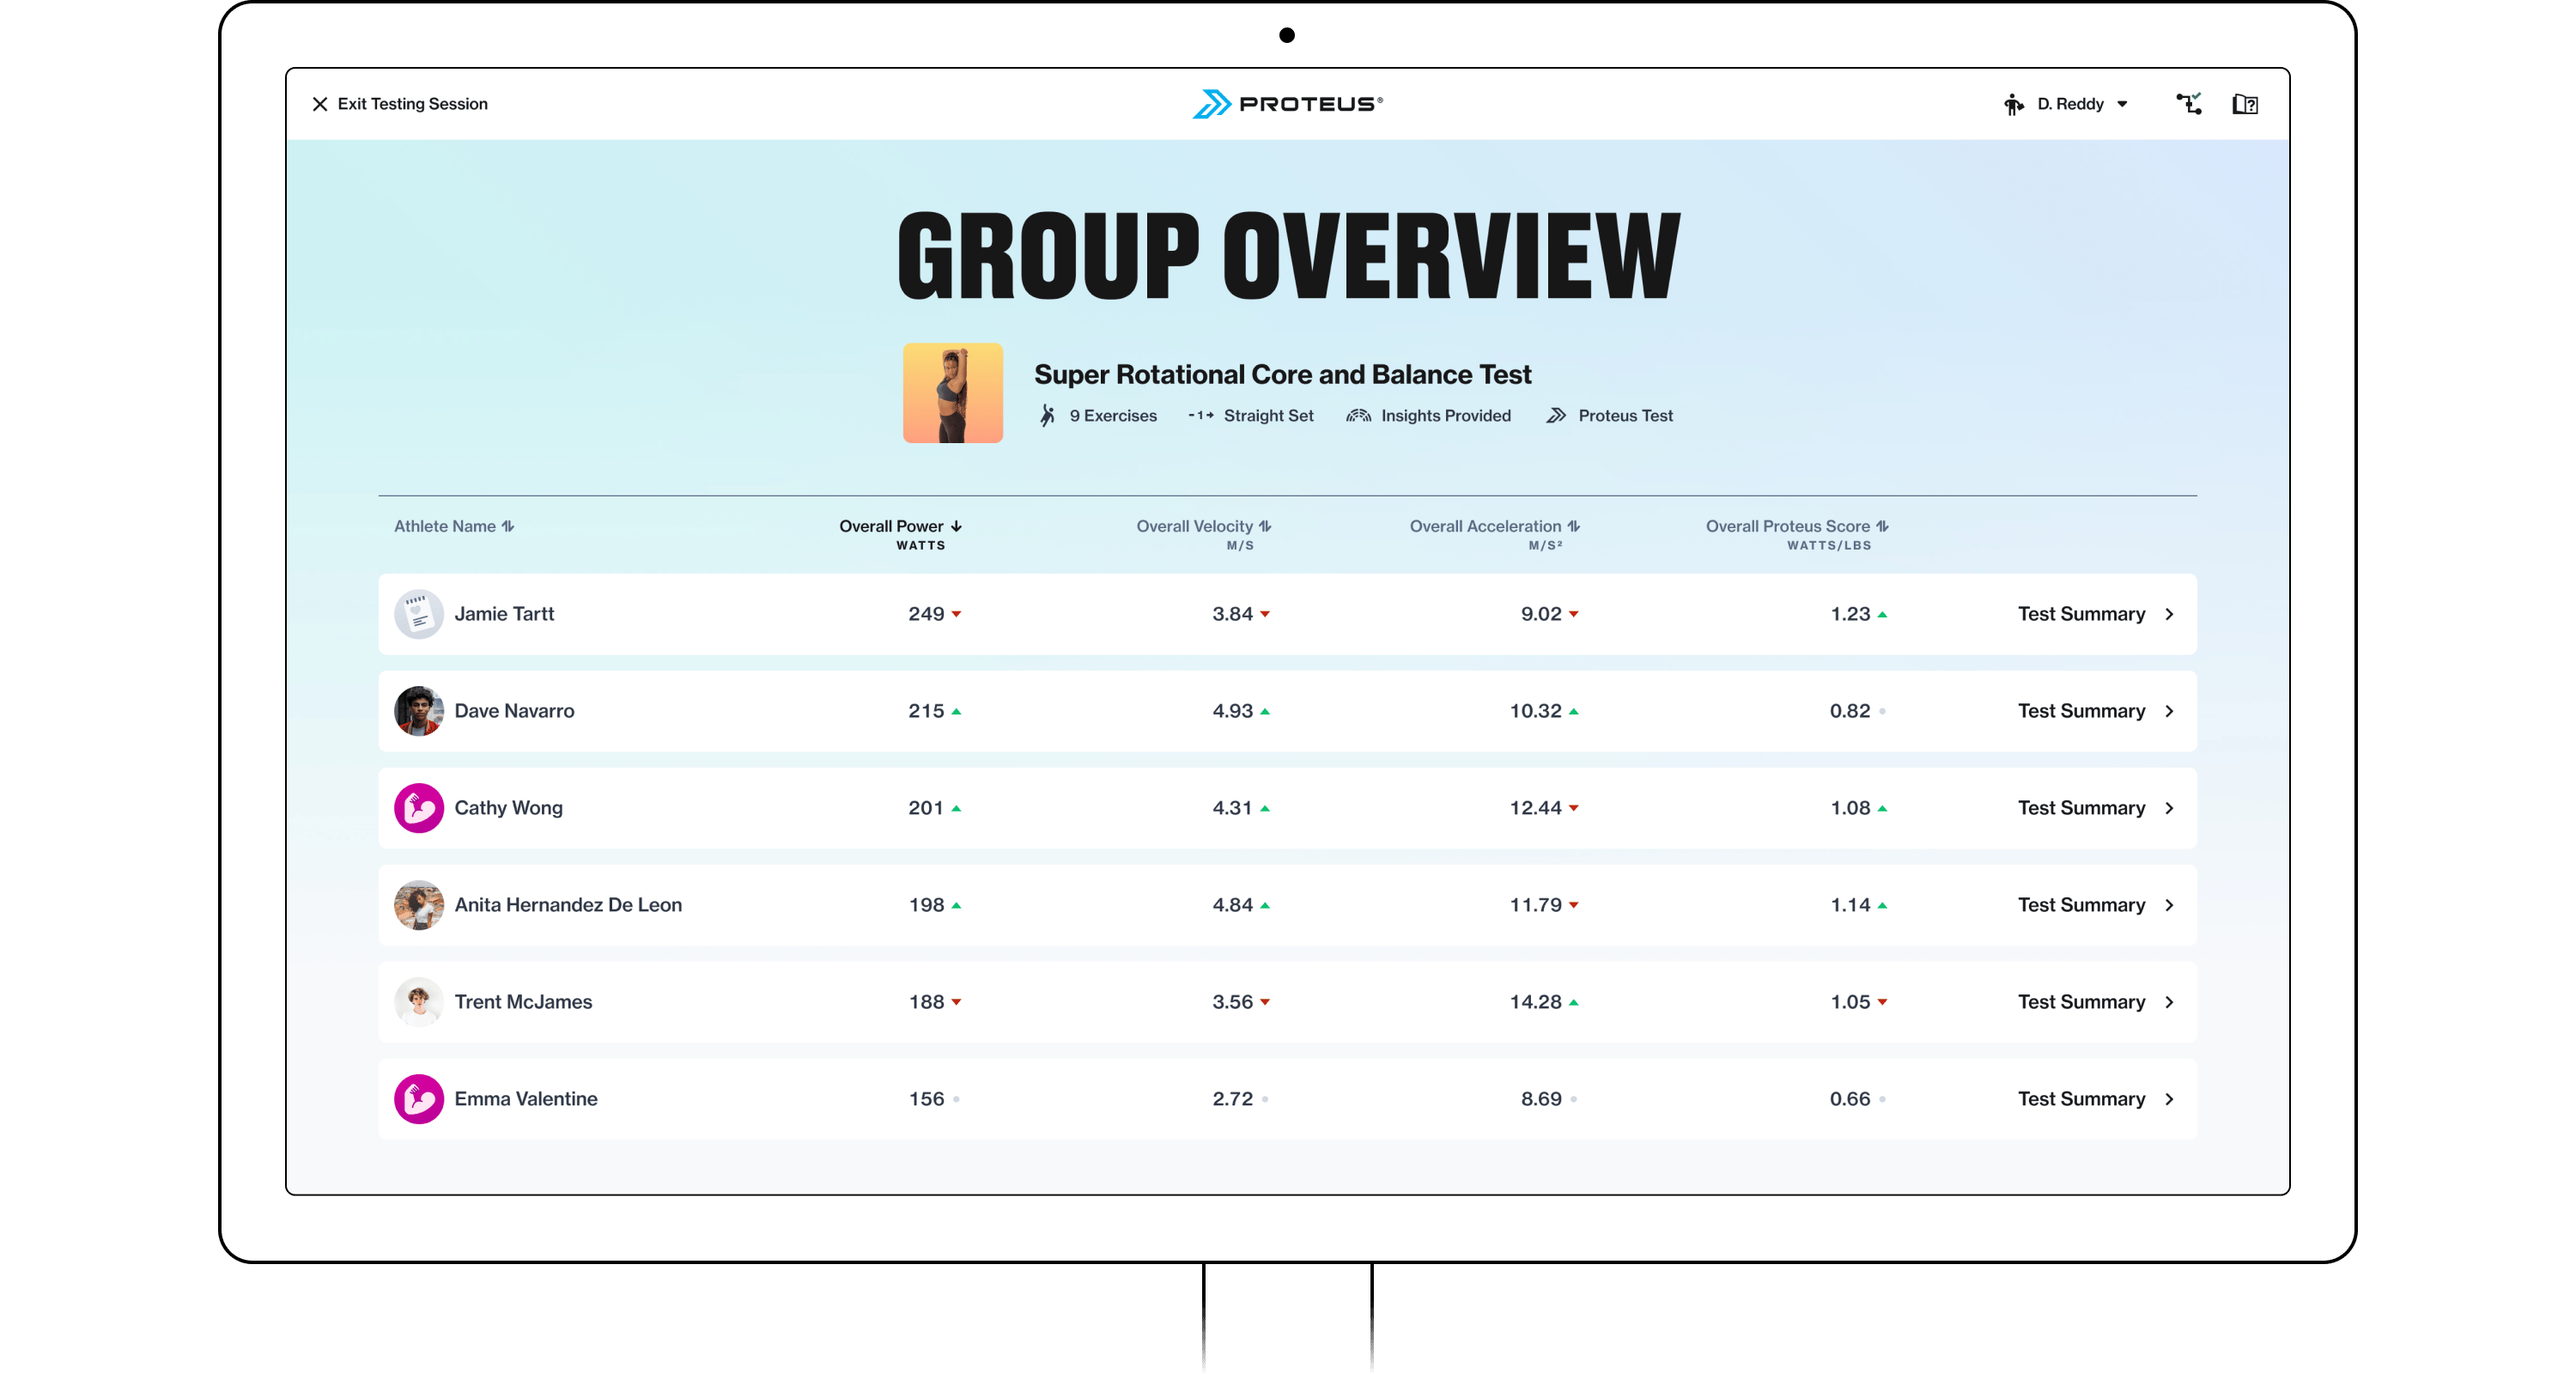
Six months after releasing group testing, we noted a significant increase in testing overall.
15%
Of sites use group testing on a weekly basis
23%
Of all tests performed as group tests
32%
Increase in testing per site overall
Full Case Study
Group Performance Testing
Product Design, B2B, B2B2C
We brought highly requested multi-user functionality to Proteus’ powerful performance assessment mode. With Group Performance Testing trainers can finally integrate Proteus into circuit-based group training sessions and more easily gather data for whole teams.
Velocity Based Training in Freestyle Mode
Freestyle is our most popular mode due to its simplicity and unstructured usage. Users can warm up, train, and quickly check performance metrics without selecting an athlete profile or program. This simplicity also allows for experimentation, making it ideal for velocity-based training (VBT). This method of training is popular among our rotational athletes such as baseball players, golfers, and tennis players. As our athlete user base is roughly 1/3 baseball and softball players, this was an opportunity to provide direct value and move into a training space typically occupied by camera-based devices such as Perch.
VBT involves moving with maximum effort within a prescribed velocity window, adjusting resistance to maintain velocity. To incorporate VBT principles into Freestyle mode, we introduced a live velocity gauge and animations to help athletes stay within their target. Users can easily select preset velocity targets, while experts can use a double slider for more precise control.
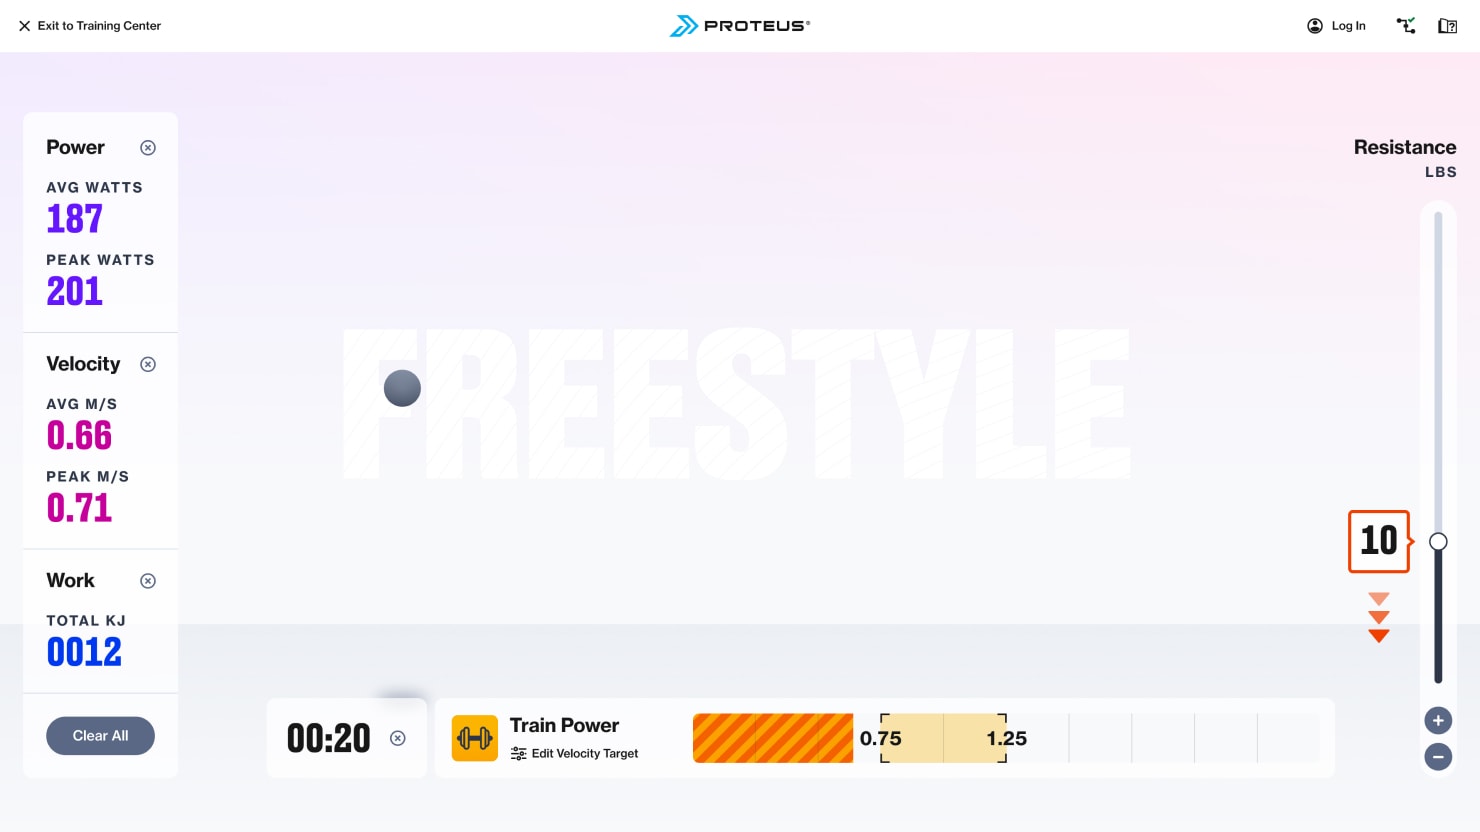
Lacking velocity in VBT Freestyle
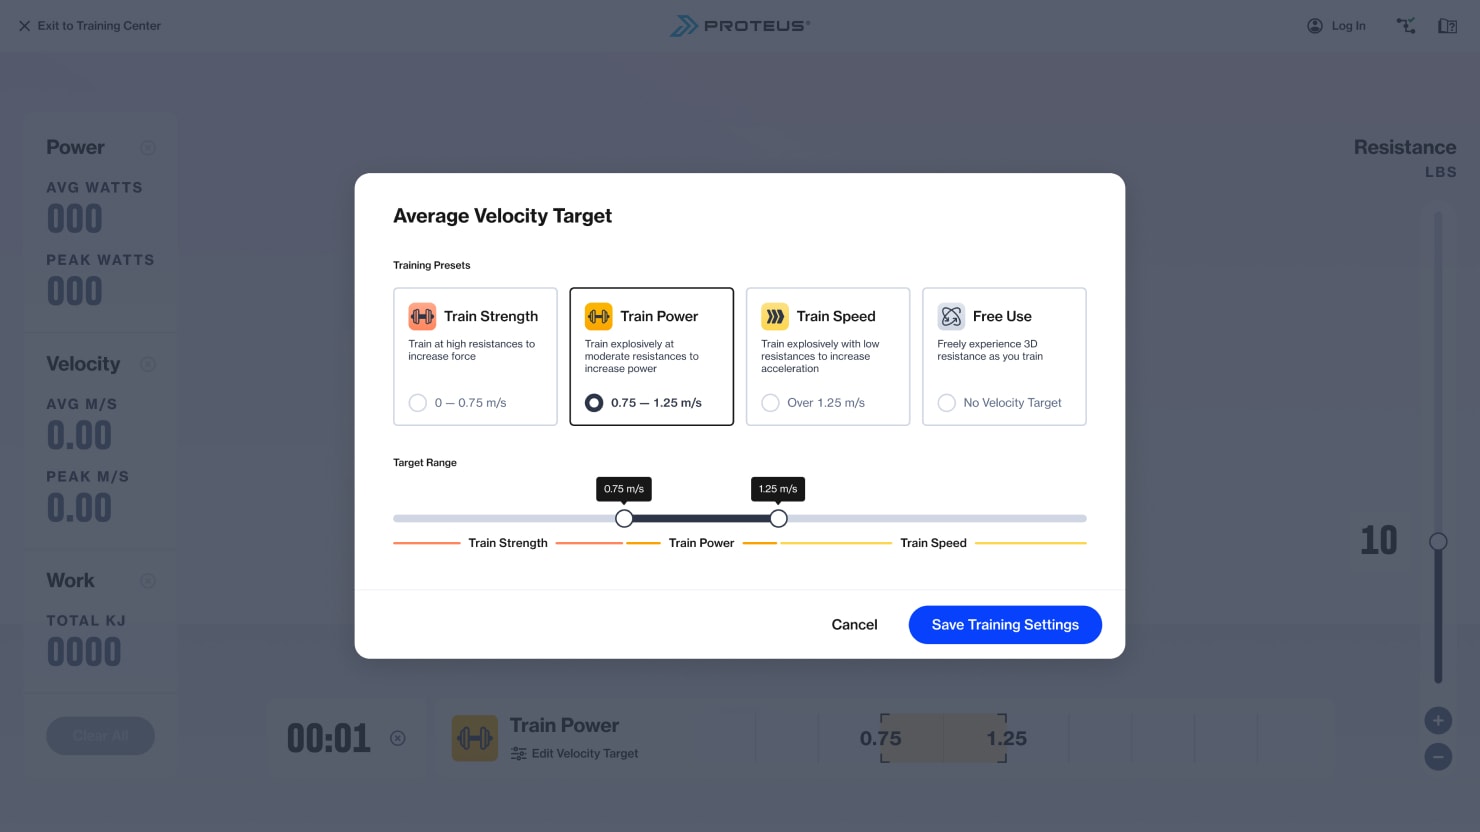
Setting VBT velocity target
Contextualizing data
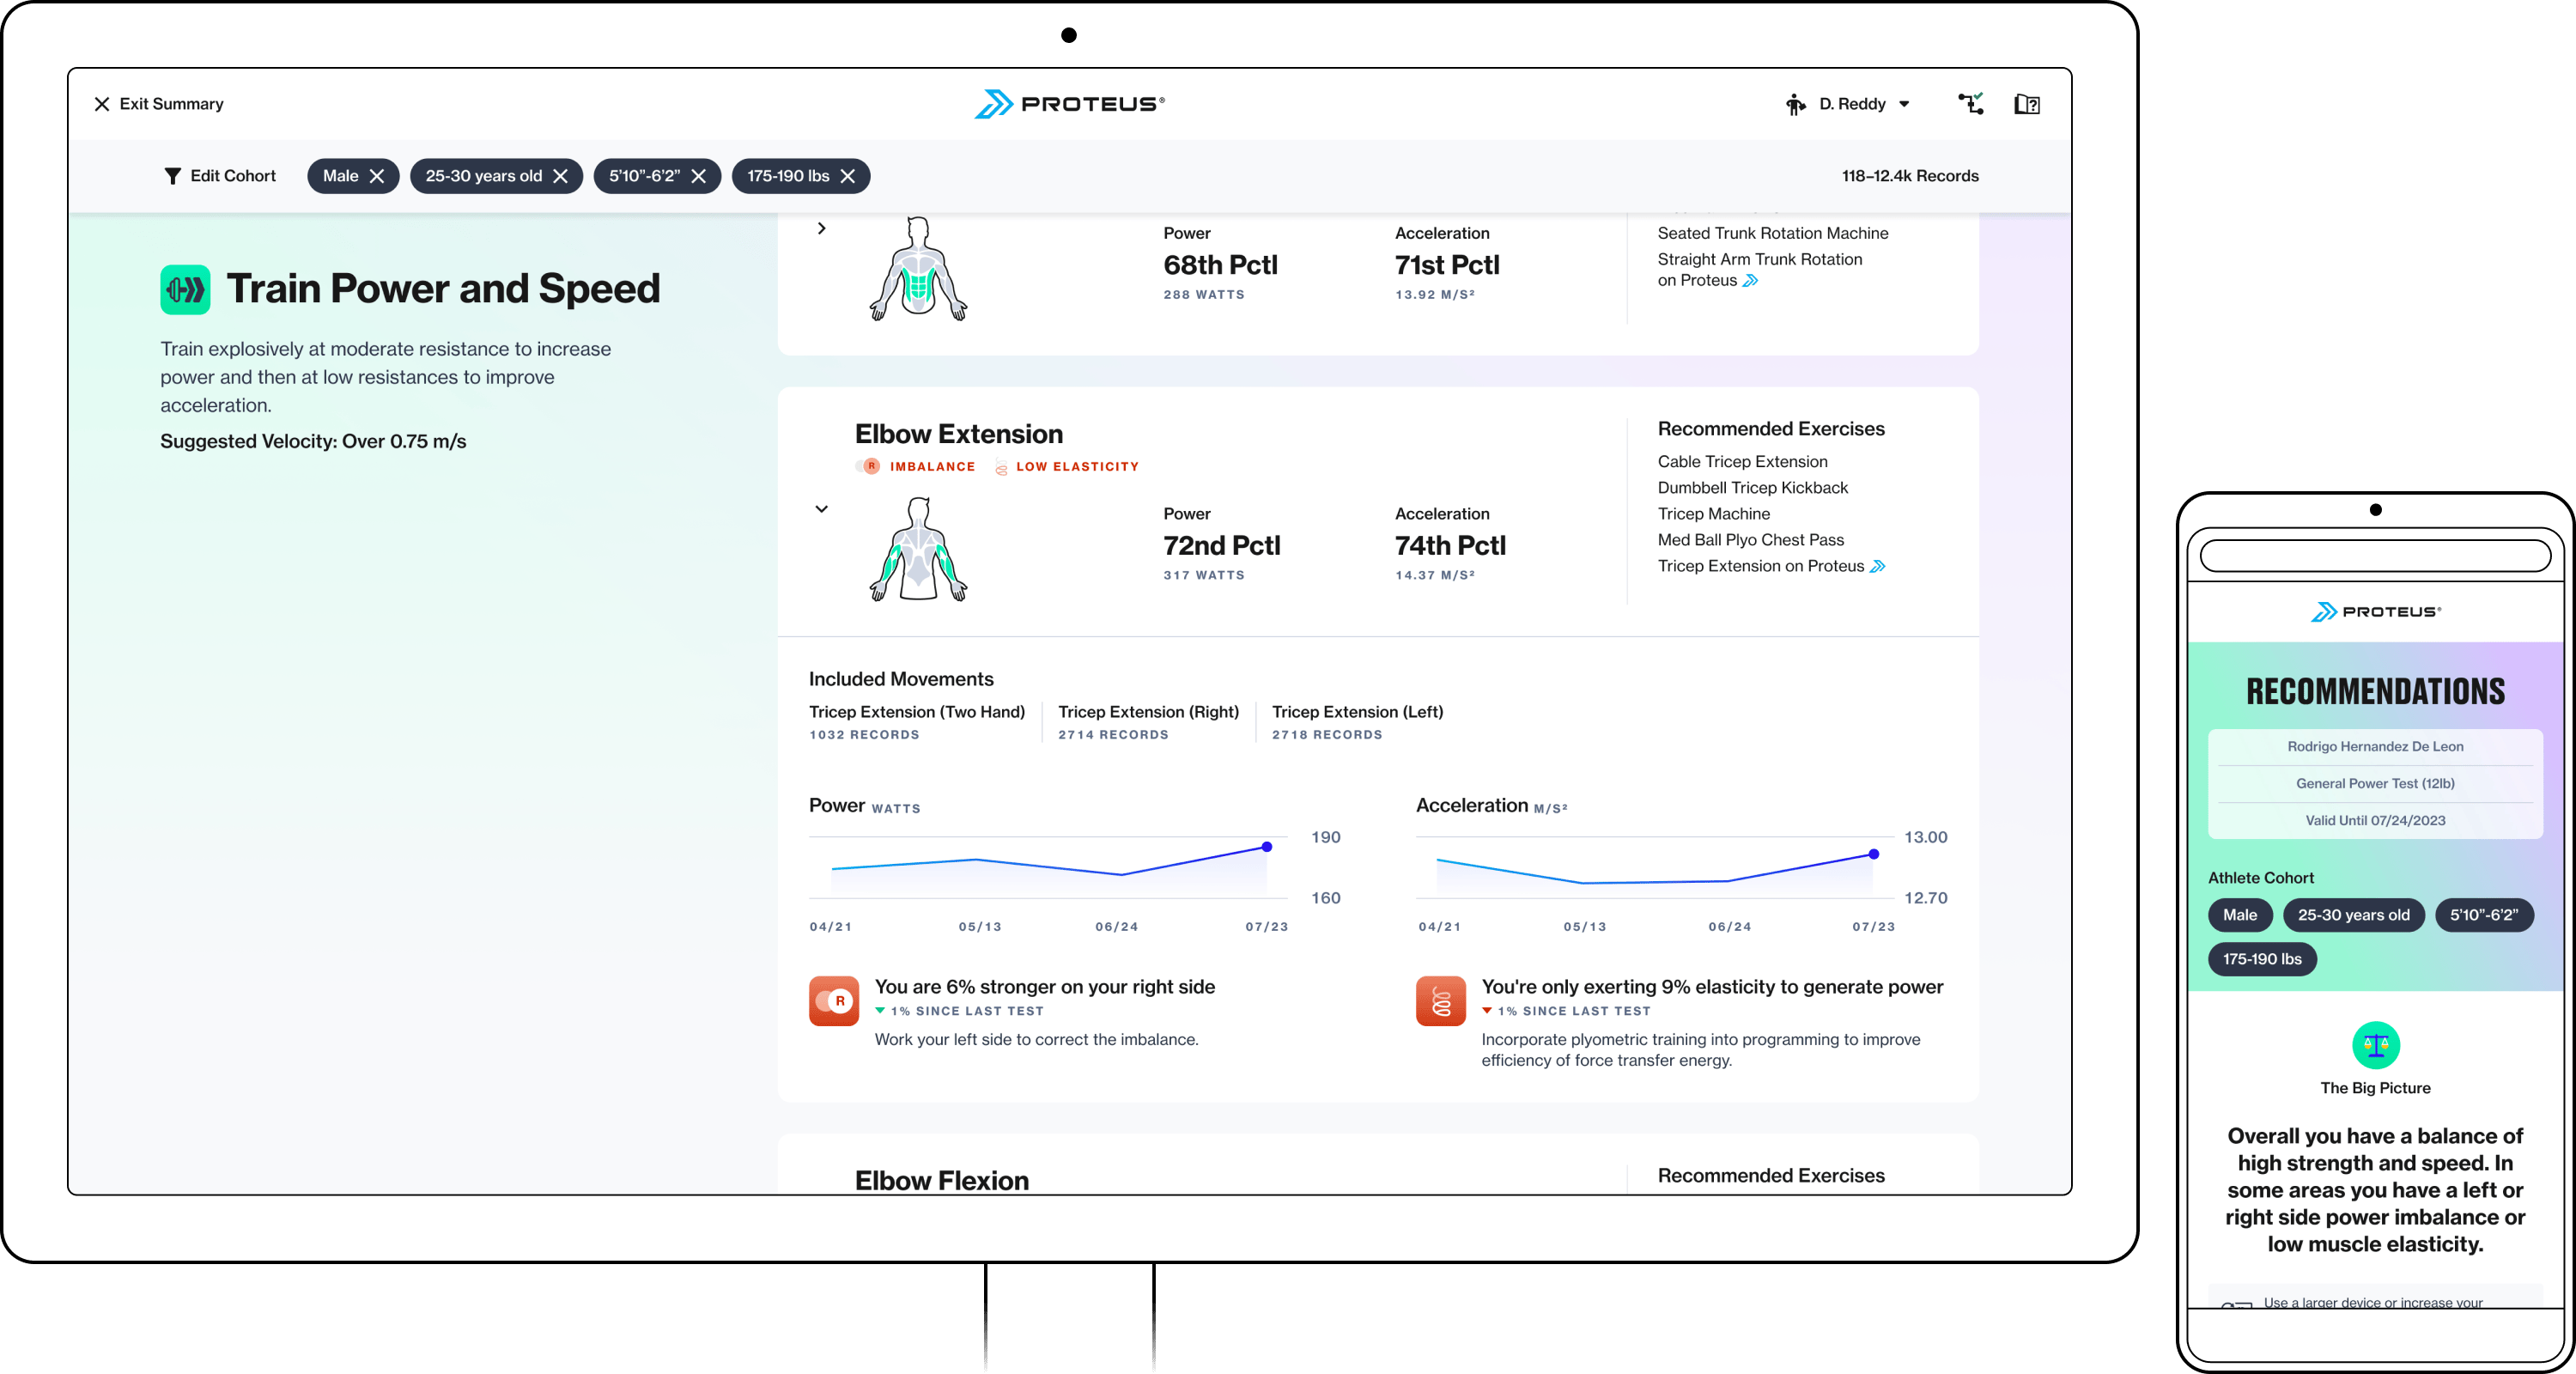
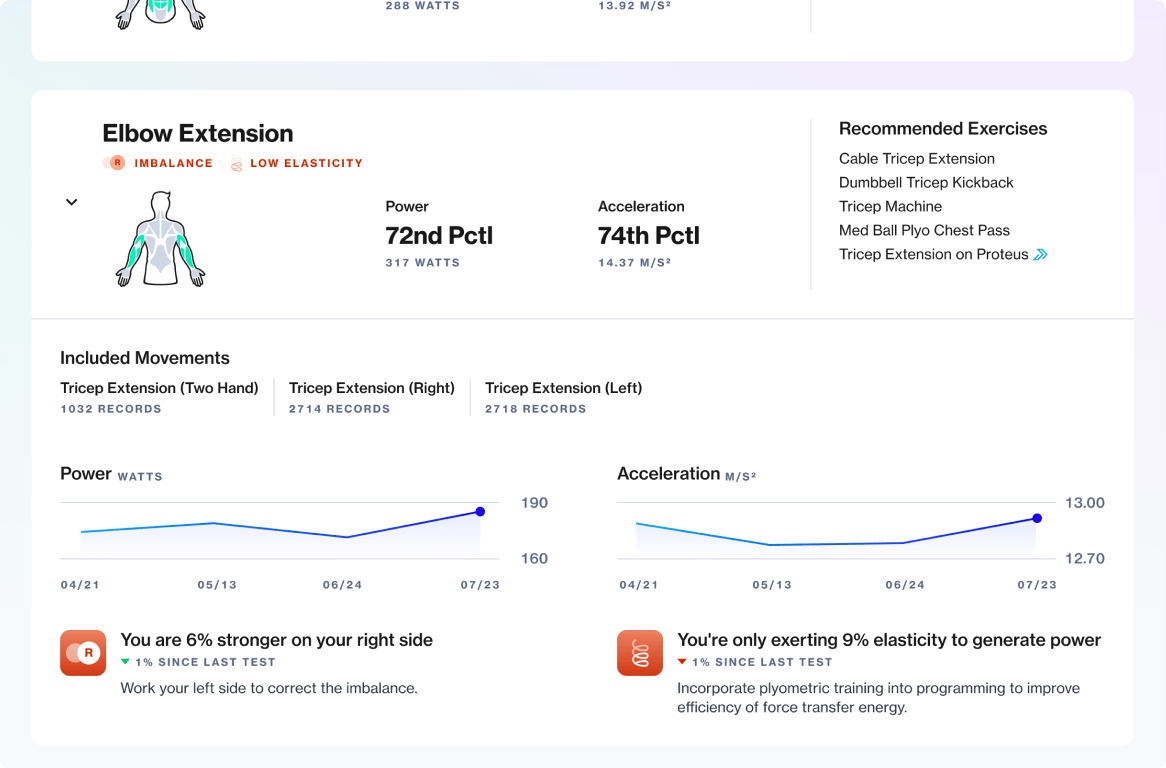
Proteus is primarily marketed as an assessment tool for measuring peak power production. Performance Testing is the sole data-capturing mode, so increasing the amount of testing helps expand our database of performance norms. This enhances the accuracy of insights for customers and their clients. Test data is displayed via the post-assessment Test Summary and on public leaderboards.
Performance Testing Insights
Testing is critical to helping athletes achieve their fitness and performance goals. When we help frame test results in an understandable way and provide insights and training recommendations, we help reinforce the trainer’s value proposition. This increases customer revenue, performance data collection, and proves out our claim of being the definitive standard for power measurement.
In reimagining the test reporting experience, I led the design effort to frame data in a personally relevant way, rethink the experience architecture, elevate the visual design, and provide engagement with the platform for users training with other tools and equipment.
We implemented and released this new experience in four phases over the span of nearly a year. This provided customer value over time and allowed us to test out new concepts that would eventually make their way into the more fully realized experience. Even after the main releases, we continue to iterate on this experience, honing the our data display and adding utility.
After the fourth phase was released, we measured impact for the following quarter via our own metrics tracking system and a trainer survey I administer twice a year.
20%
Increase in testing at sites that were frequent testers
24%
Increase in testing across all sites
10%
Increase in trainers who reported Performance Testing as their most frequently used mode
Full Case Study
Performance Testing Insights
Product Design, B2B, B2B2C
In order to prove out Proteus’ value proposition as the definitive standard for power measurement we needed to improve the improve the user experience of our performance data reporting. The feature aimed to empower trainers with data an insights and increase the rate of data collecting testing sessions across our customer base.
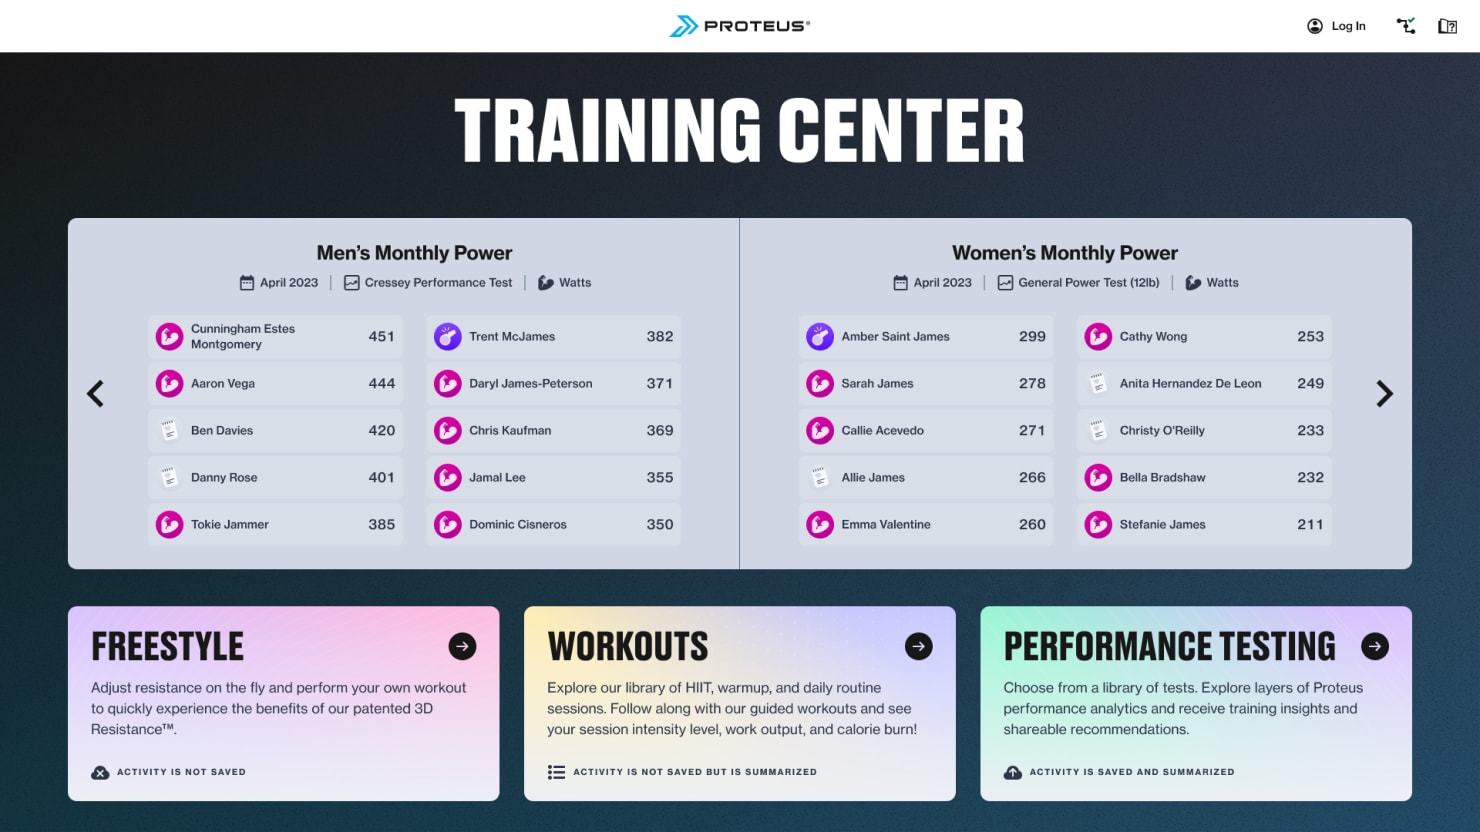
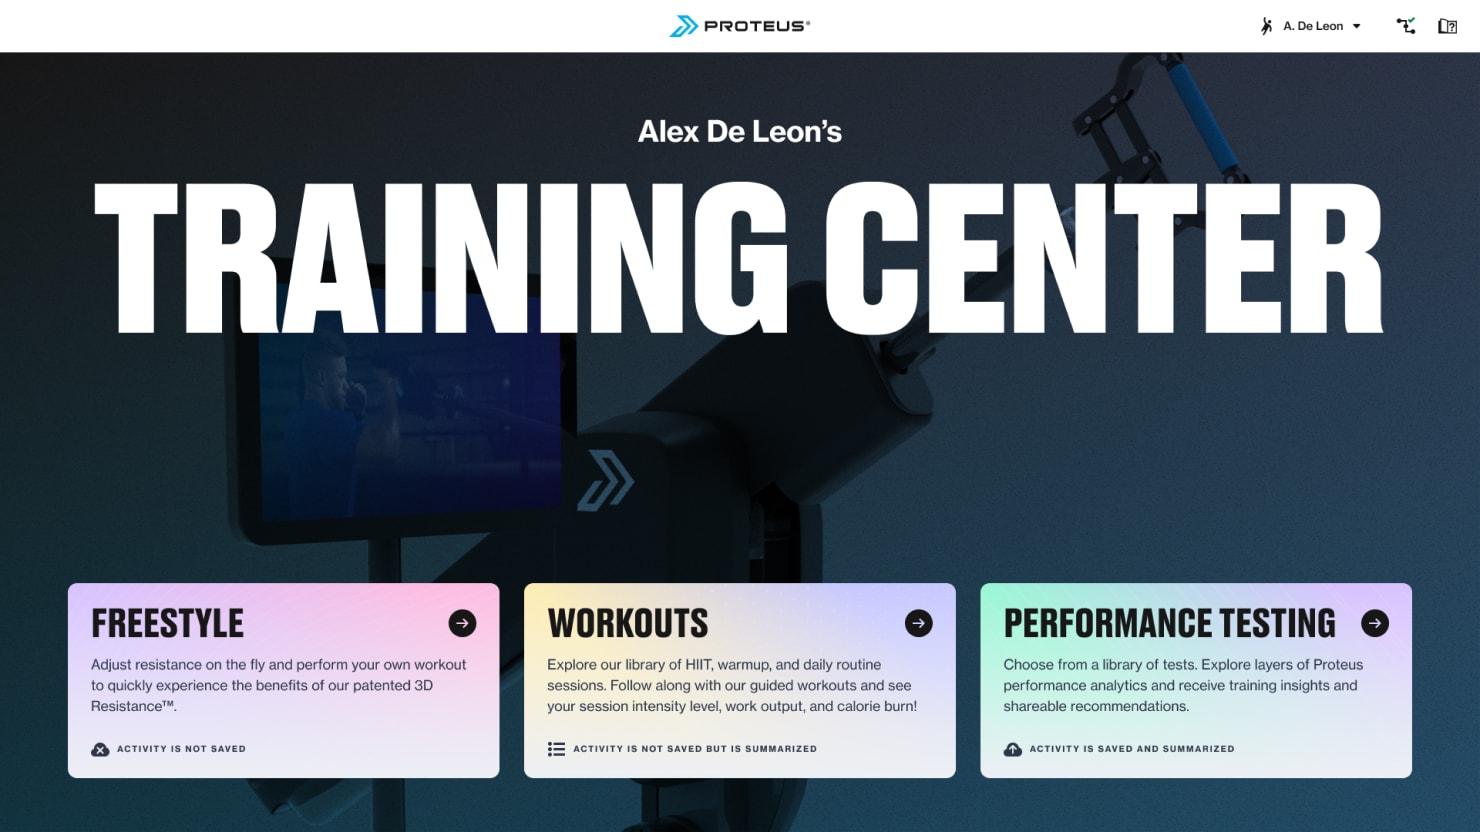
Training Center Leaderboards
Creating a competitive and positive environment is crucial for our customers. They use Proteus test data to compare athletes and foster friendly competition. We leveraged this by populating local site-level leaderboards to increase engagement and testing.
Proteus’s home state, the Training Center, serves as the launch point for training and testing modes. Previously, it displayed a looping promotional video, which served little purpose. I proposed using this space to show local leaderboards instead, reflecting key metrics from our test reports.
We decided on eight leaderboards: peak power and acceleration, per gender, for the current month and full year. Customers can customize their site leaderboards by selecting desired tests for source data, opt-out individual athletes, or deactivate the boards entirely. Additionally, I used this project to refresh the Training Center, aligning it with updated brand guidelines and streamlined activity mode descriptions.
Leaderboards active on Training Center
Leaderboards hidden on athlete’s Training Center
Reducing manufacturing and servicing costs
Building and maintaining a software-enabled hardware product is costly, as moving parts can break. If the software relies on the hardware performing perfectly the stakes are even higher. However, software and design can reduce manufacturing costs by improving factory efficiencies and lower servicing costs by mitigating damage from users.
Software Assisted Unit Calibration
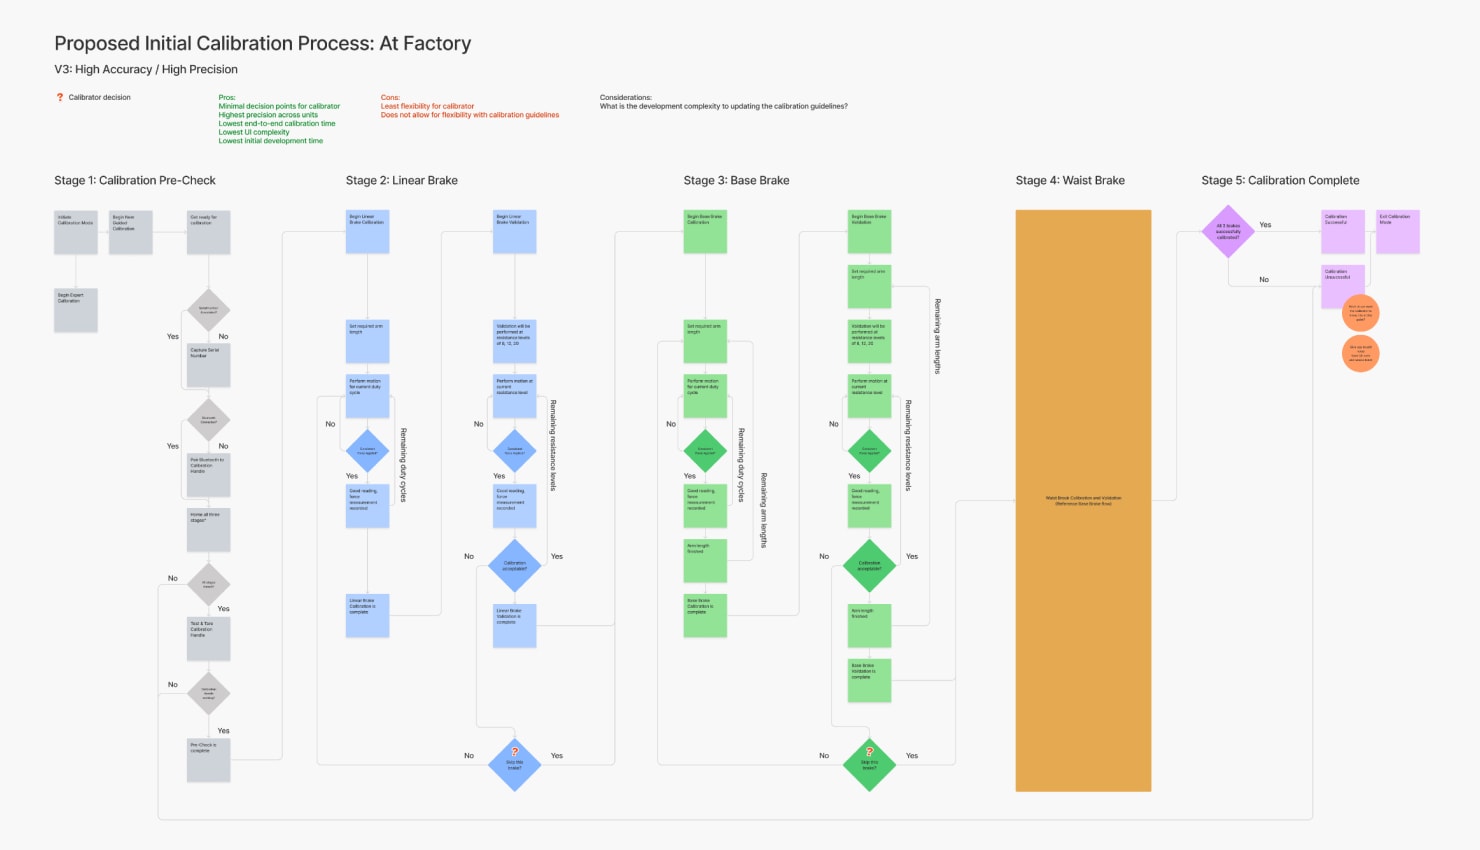
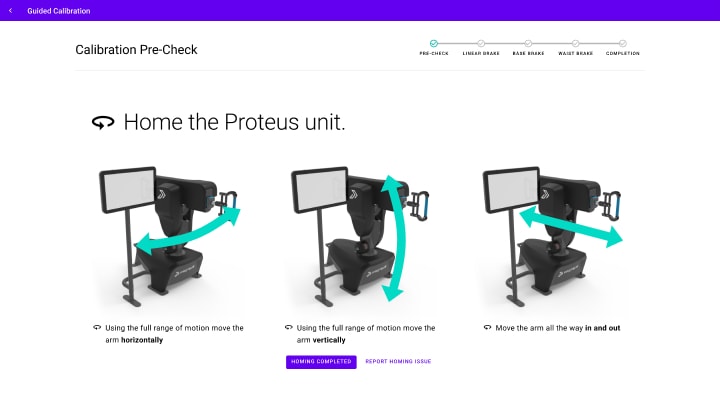
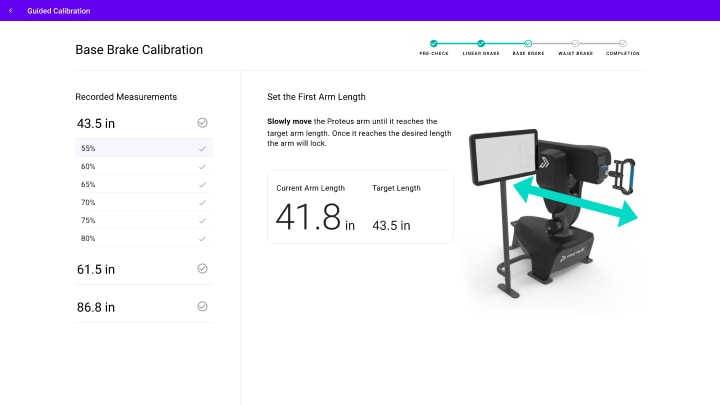
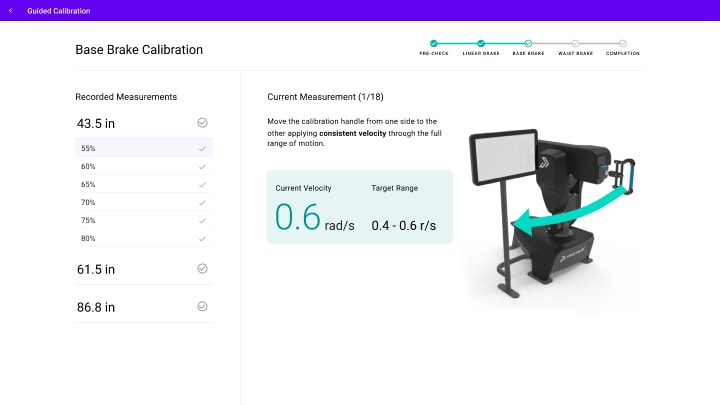
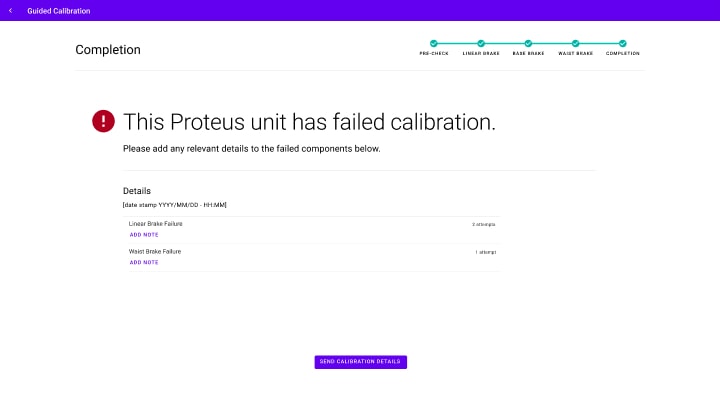
My first project at Proteus Motion focused on reducing calibration time for our hardware at the manufacturing facility. As we were starting our first large-scale production run, ensuring consistent 3D resistance for each unit was crucial. The existing calibration process was tedious and error-prone, requiring manual transcription of force meter readings into a spreadsheet and then into each unit’s settings before shipping.
Collaborating with the software and hardware teams, we created a custom handle with a built-in force meter that transmitted readings directly to the software via Bluetooth. I designed a straightforward software-guided approach that significantly reduced the learning curve, time spent on calibration, and occurrence of transcription errors.
This project, essential for scaling our production, reduced calibration time by about 87% and was a valuable introduction to the complexities of our hardware.
Minutes spent calibrating each unit
120 → 15
SW enabled calibration process
Guided calibration experience
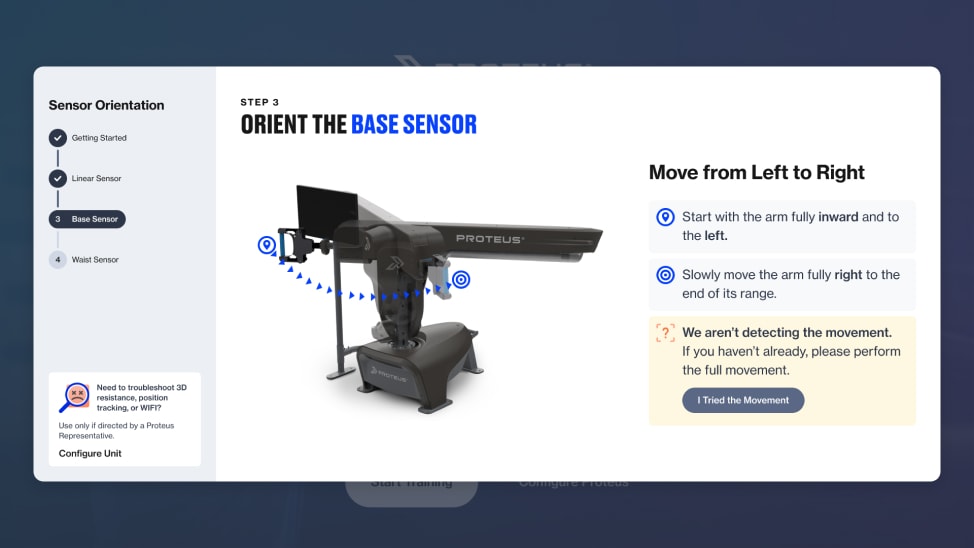
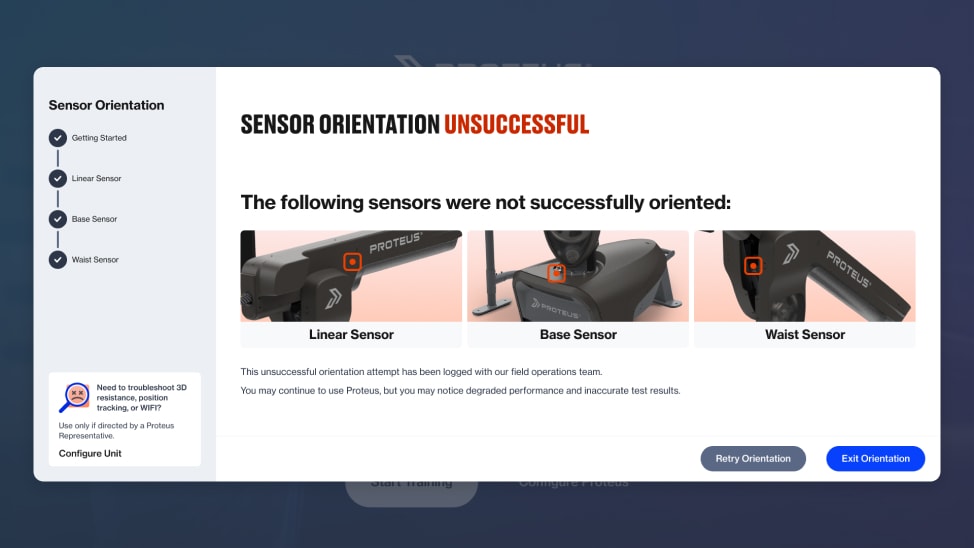
Sensor Orientation Wizard
I designed a customer-facing wizard to ensure Proteus unit orientation, crucial for accurate tracking and recording position data in 3D space. Upon a hard reset, Proteus’ firmware “forgets” it’s oriented state, so it requires a manual triggering of each of the three sensors responsible for reporting the handle’s position.
Customers often skipped prompts to orient the unit, causing erroneous readings and unnecessary support tickets. Our solution mandated orientation upon startup, guiding users through the process and preventing them from skipping steps. This feature also identified hardware issues that wouldn’t be obvious to users, automatically generating support tickets which created efficiencies for our Field Operations team.
Orientation Wizard flow
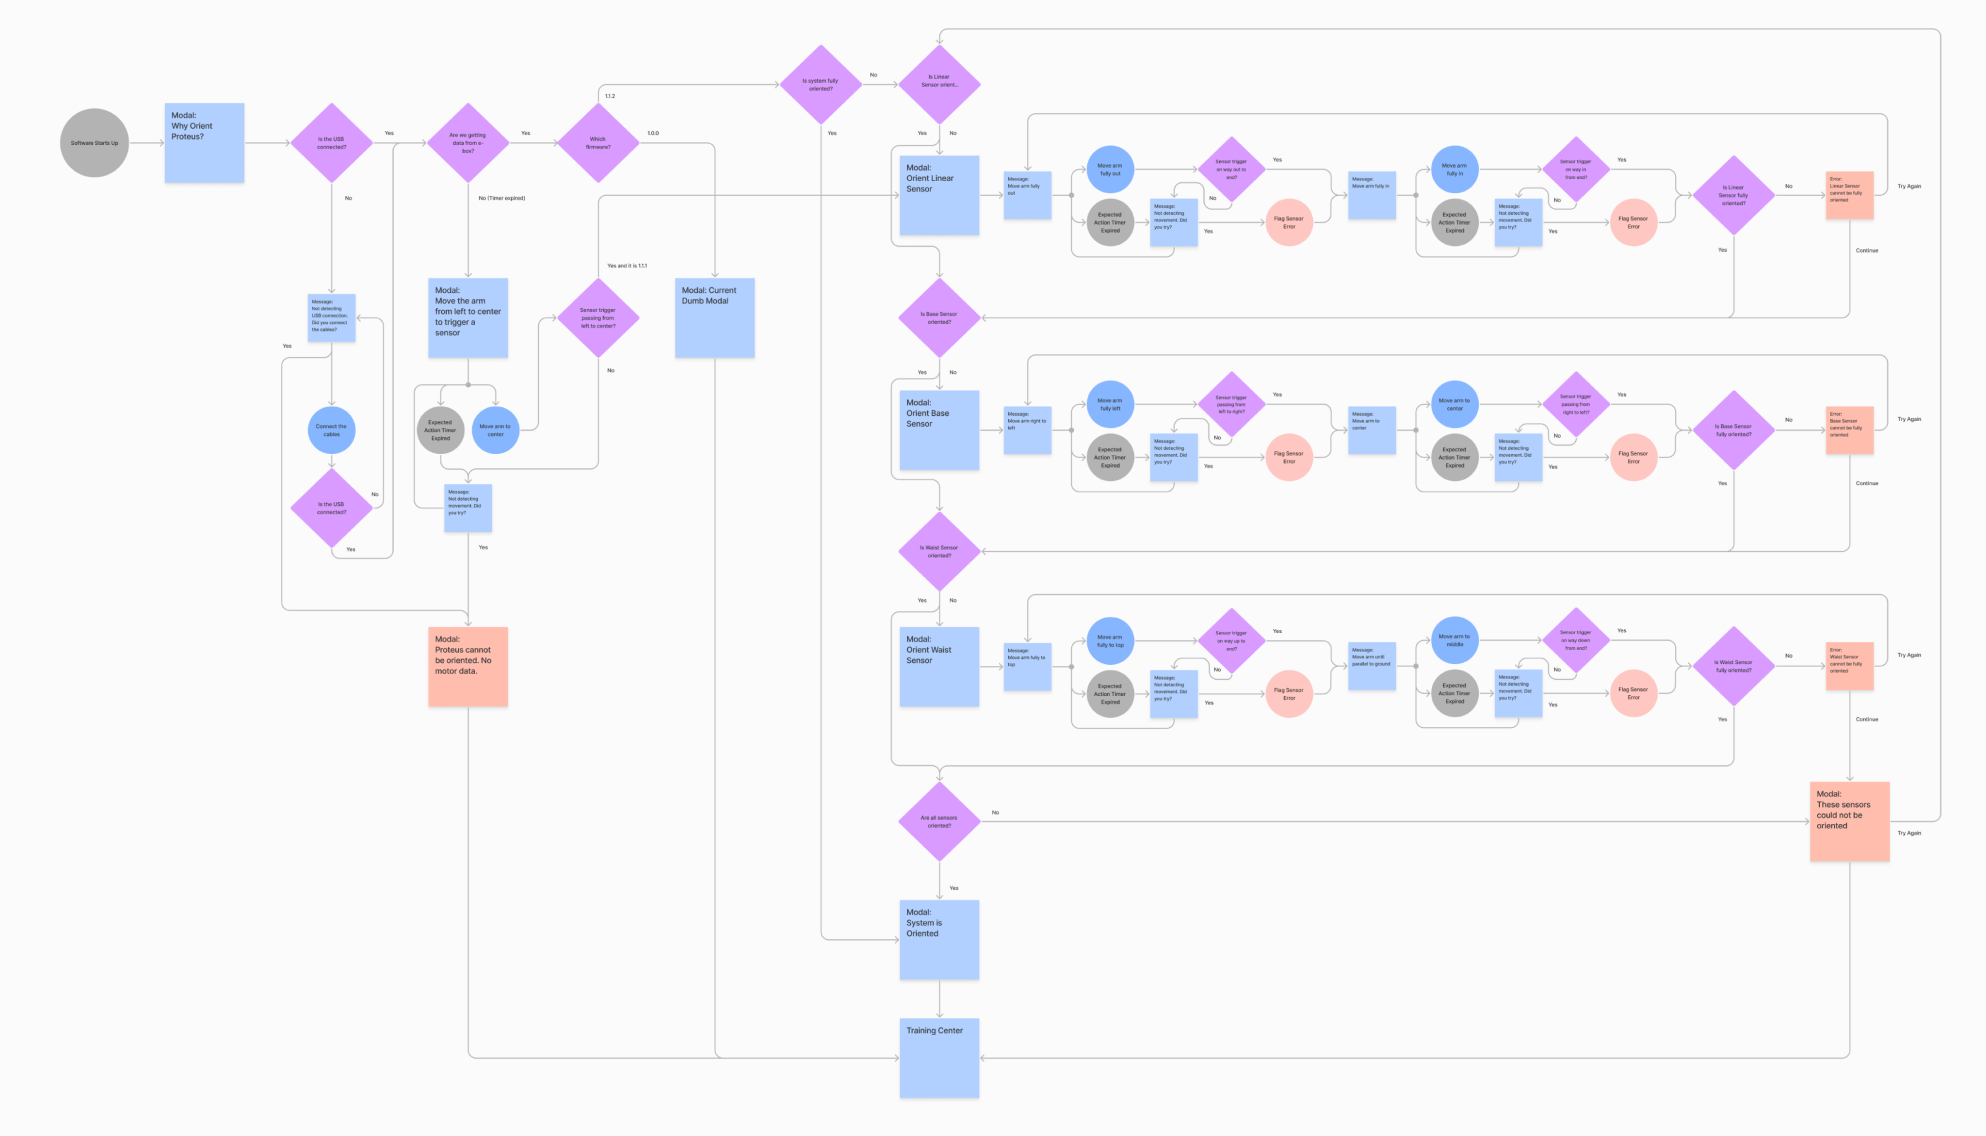
Orientation upon system boot
After enabling the Sensor Orientation Wizard for all eligible customer sites, we saw a nearly immediate decrease in sessions performed in an non-oriented state.
Percentage of sessions performed in a non-oriented state
22.3% → 6.5%
Damage mitigation in Freestyle Mode
As a product designed to be used by a broad spectrum of athletes, the hardware is fairly resilient but is still subject to regular wear and tear. If its handle is forcefully moved to its extremes, it can damage the bumpers or housing and potentially damage a sensor causing a loss of, or incorrect data readings. This will disrupt customers and incur repair costs.
Most sessions occur in the Freestyle mode, making it ideal for updates to reduce end-range impacts. To prevent this, we implemented a modal providing guidance on where athletes should stand, only dismissing when the handle is in the acceptable range. If the handle approaches an end-range too quickly, a visual and audio cue inspired by first-person shooter games prompt users to adjust their position to avoid causing damage.
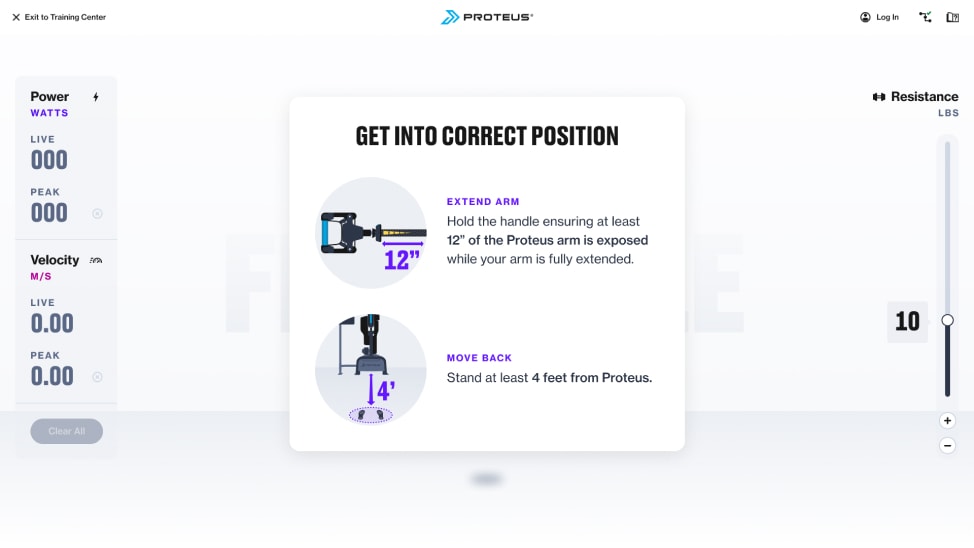
Get into the correct starting position
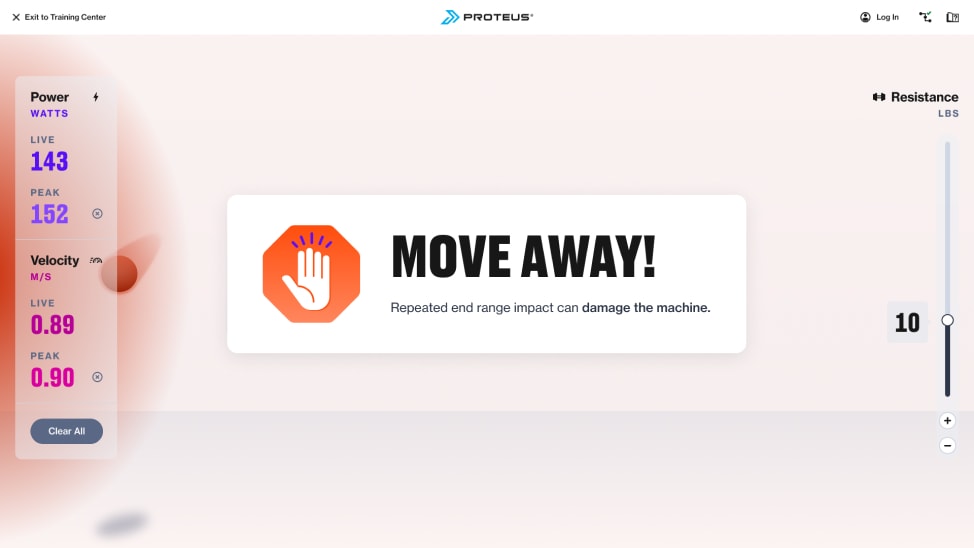
Hitting the base (left side) end-stop
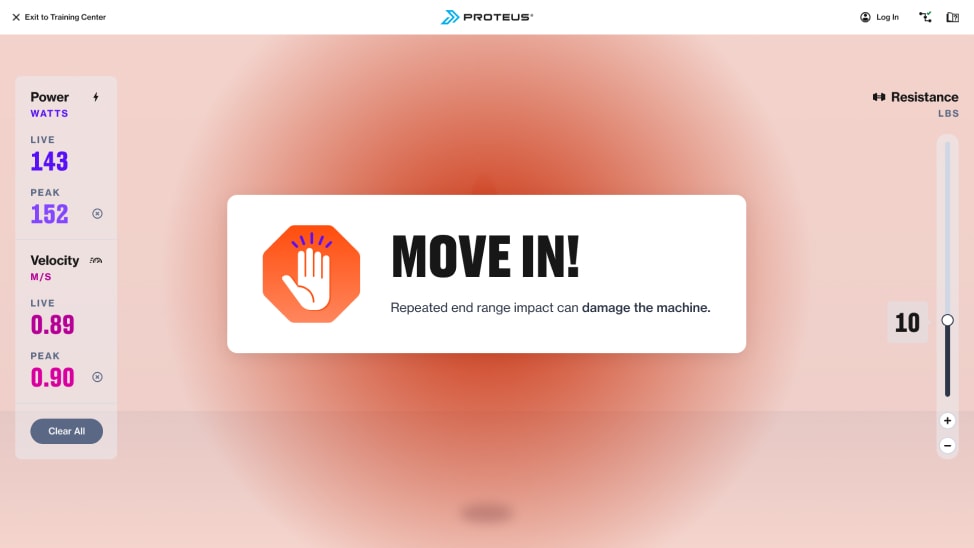
Hitting the linear (away from Proteus) end-stop
We saw significant success from implementing these measures and anticipate this helping prolong the lifespan of hardware components and reducing maintenance costs over time.
Average occurrence of end-stop collisions per Freestyle session
22.5 → 2.5
© 2024 Will Gabrenya